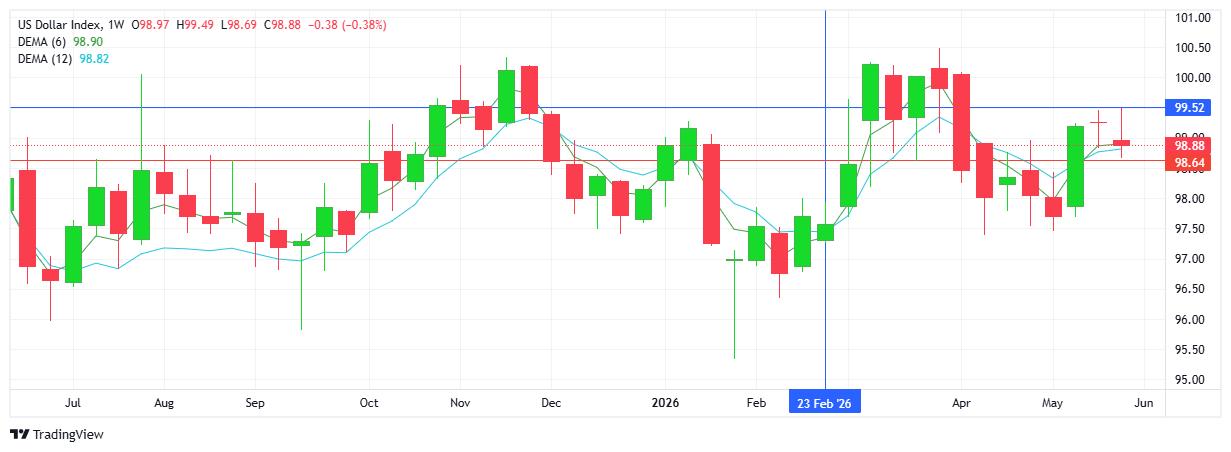
USD INDEX
Sellers won out on the week, adding a lower high and lower low on the chart. However, the small red body, alongside the previous week’s doji-like candlestick confirms the uncertainty and lack of direction for the world’s reserve currency. The ley 99.00 level continues to be a pivotal dividing line between buyers and sellers. The index struggles to rally as capital continues to flow into equities, as well as gold’s resilience holding relatively firm, and while Fed is currently somewhat bullish, long-term cuts are still on the table. Resistance at 99.52 with support at 98.64.
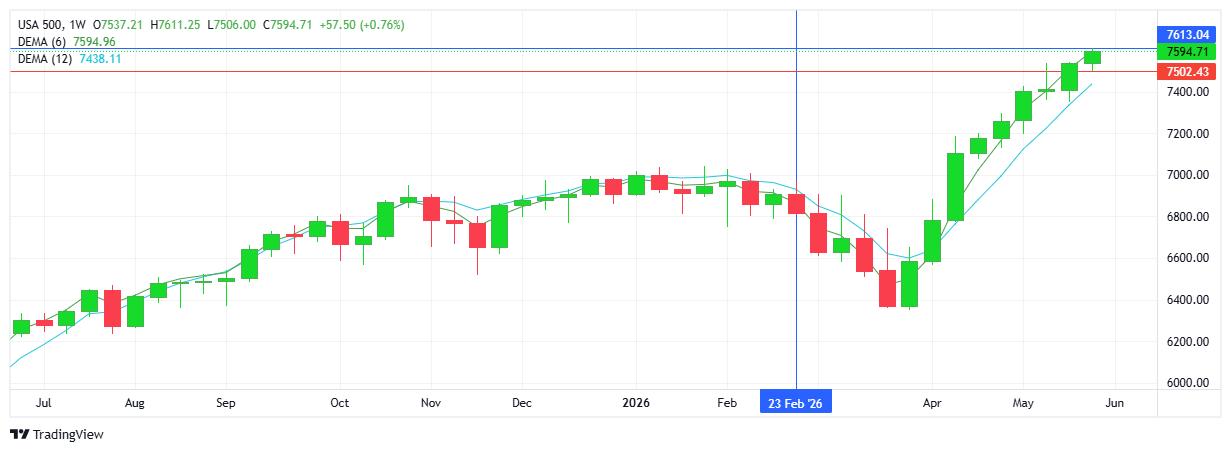
S&P 500
Another week, another record high for the index. a 9th consecutive green candlestick with higher highs and higher lows adding to the uptrend. Profit taking and overbought technicals have not entered the big picture as yet. A struggling USD and the risk-on theme continue into the new month. AI and technology stocks lead the way with earnings continuing to surprise positively. Inflation risks taking a backseat for now. Resistance at 7613 with support at 7502.
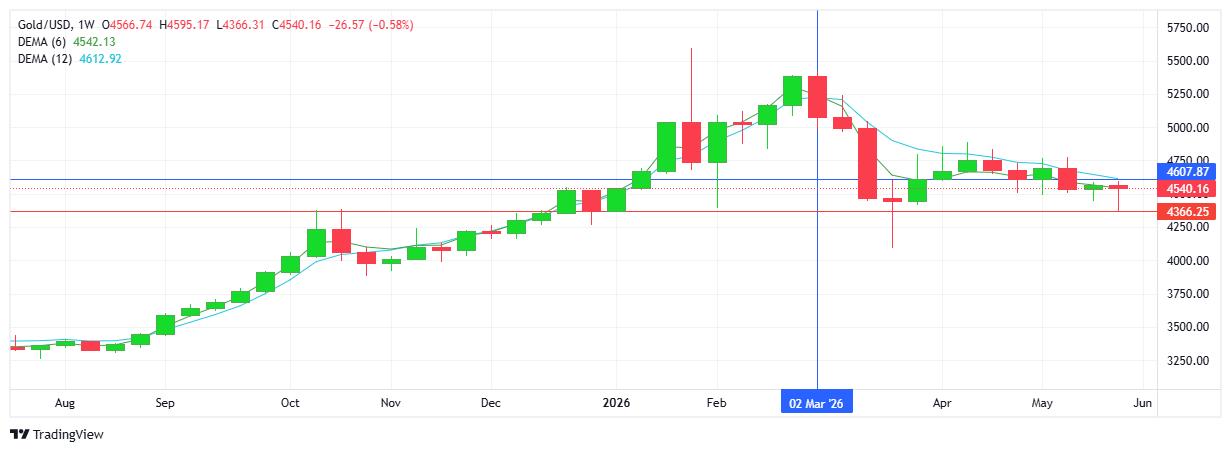
GOLD
Buyers ended the week on the front foot, recouping losses from early in the week and going on to close above the psychological $4500 level. While the downtrend remains intact, the metal continues to show resilience as sellers struggle to hold onto attempts to maintain below the $4500 mark, despite the Fed being in a bullish mood for now. Note the relevance of current support which acted as resistance in October 2025. Interesting that the safe -haven commodity remains elevated in spite of the S&P trading at record high levels. Resistance at $4607 with support at $4366.
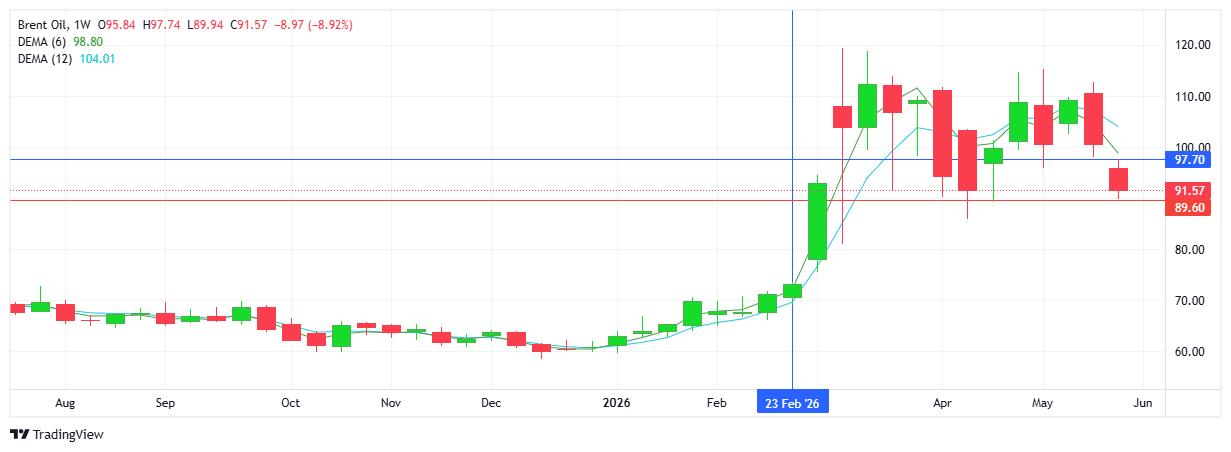
BRENT OIL
Oil is no longer trading the current disruption, it is trading the expected future outcome. The forward -looking oil market peaked to the $120 area anticipating a worst- case scenario. The current $90 area reflects optimism that a deal/ceasefire will be reached and the straits will be open. Also contributing is the expectation of a global economic slowdown which lowers demand concerns. Resistance at $97.70 with support at $89.60.
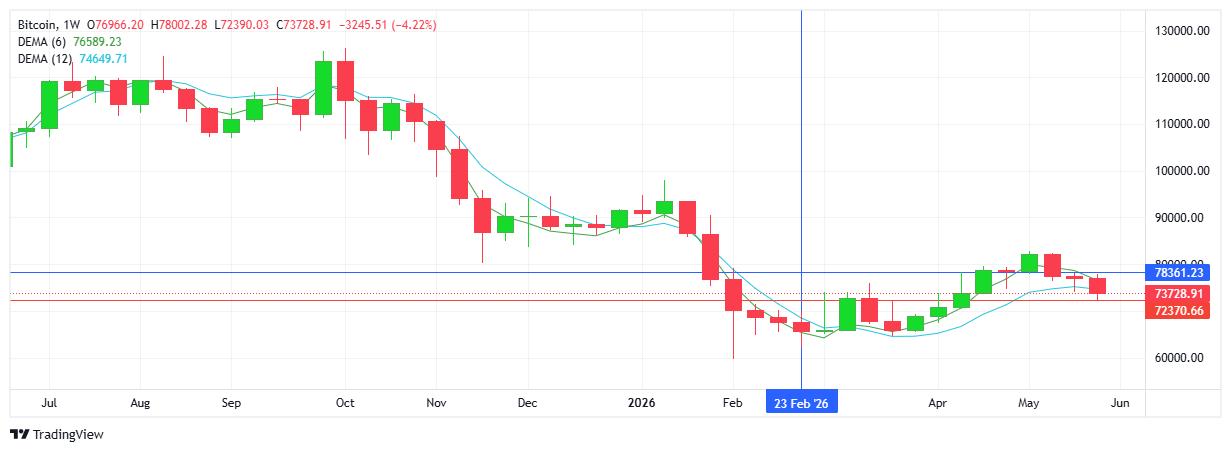
BITCOIN
Sellers remain in control with a 3rd successive red candlestick reflecting lower highs and lower lows on the chart. Lack of demand for the cryptocurrency has curtailed intraday bounces as sentiment and bias remain tilted to the downside. On the positive side (taking a slightly longer-term view) is that despite current weakness, institutions have not disappeared and spot bitcoin ETFs still hold substantial amounts/positions. Resistance at $78.3K with support at $72.3K.