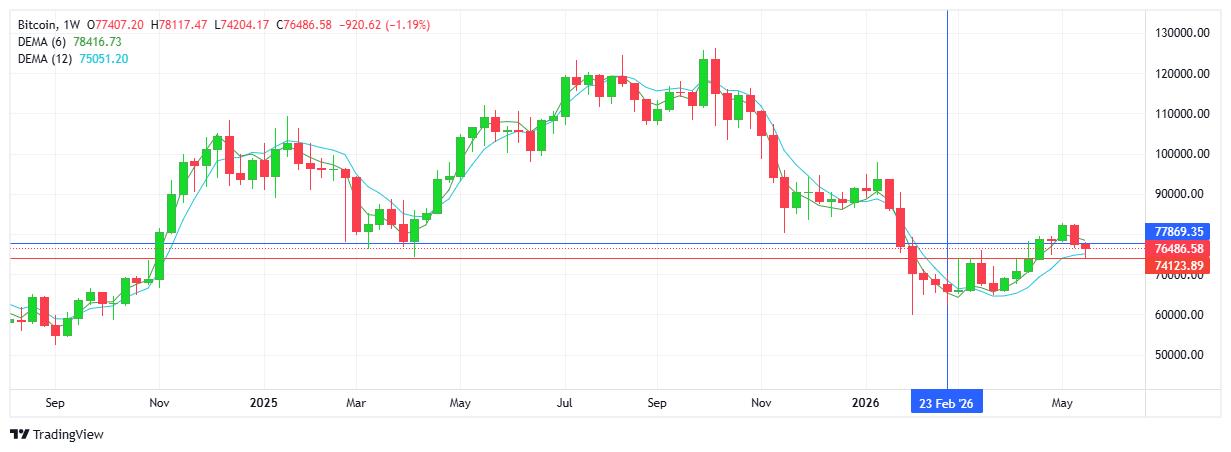
USD INDEX
The doji-like candlestick confirms the lack of new direction as the index closed back where it started. However, buyers did enough to signal an uptrend (MA s crossed to upside) with a higher high and higher low on the chart. High yields with Fed turning bullish, USD data continues to outperform and the unsettled geopolitical situation (Middle East conflict) attracts safe-haven demand?all contributing. Buyers will aim to maintain above the 99.00 mark while sellers look below the same level. Resistance at 99.46 with support at 98.85.
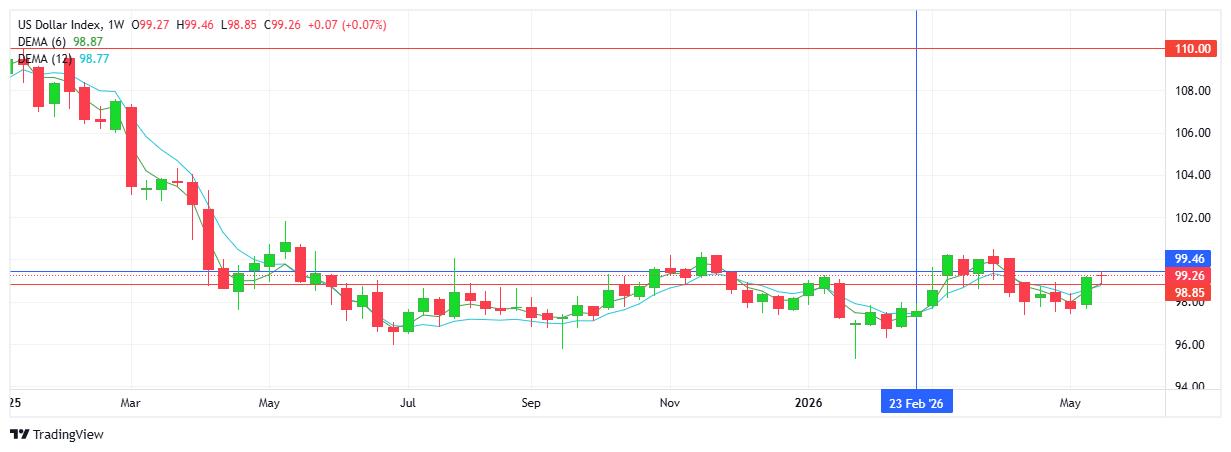
S&P 500
The uptrend continues with demand for US equities across the board as the risk-on theme remains. Note the 8th consecutive green candlestick with the succession of higher highs and higher lows. Unusual that equities and USD moving (higher) in the same direction - capital flowing into American assets as well as cash. Strong earnings - AI and Tech leading, Fed talk of rate cuts, and FOMO - investors don’t want to miss out on the bull run. With record highs being reached and overbought technicals, there will be a bout of profit-taking, just not yet. Resistance at 7523 with support at 7354.
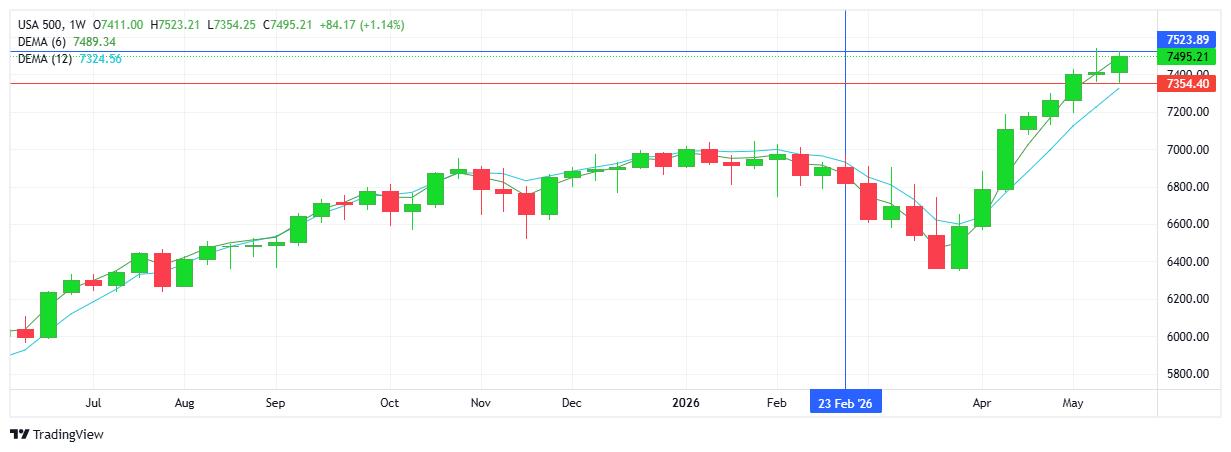
GOLD
Notwithstanding the narrow range and limited activity, sellers won out for the week with a lower high and lower low adding to the downtrend. The weekly close hovering around the $4500 area appears to be a comfort zone for now. Note buyers have defended current support area successfully all through 2026. While the commodity’s safe haven status remains unquestioned, demand for the metal has taken a breather for now. A strong USD, higher yields, demand for equities and continued bouts of profit taking following last year’s historic rally all contributing. Resistance at $4586 with support at $4446.
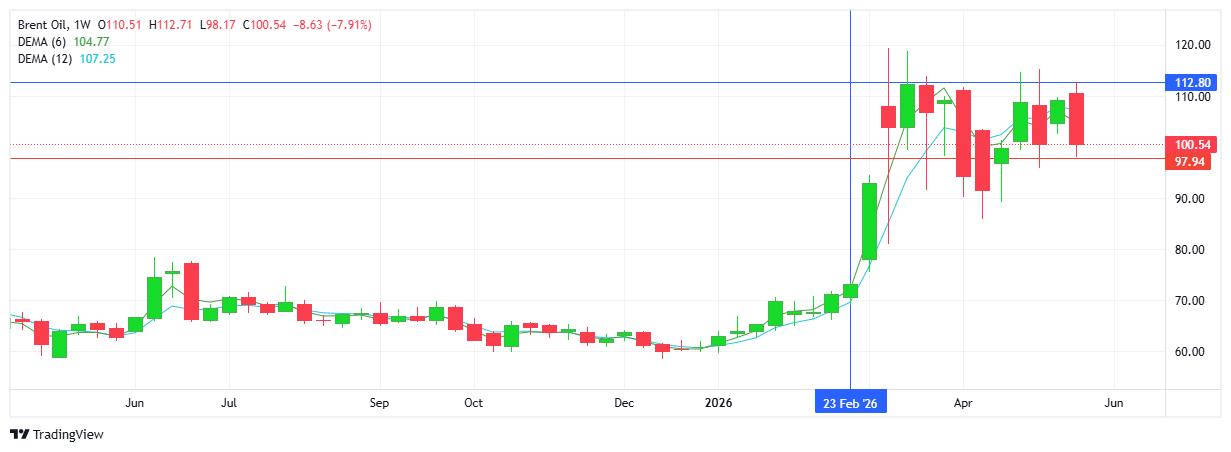
BRENT OIL
The forward- looking oil market is in optimistic mode with the US announcing that a deal with Iran is imminent. Going into the new week prices hovering close to the pivotal $100 dividing line. Interesting that this level has become the new normal. Should the straits be practically opened, optimism will be reflected in prices trading lower; however, Iran has not agreed to US proposal and as such the risk of a spike up remains possible and a pessimistic/ worse case scenario outlook will see market prices looking up to the $110 area. Resistance at $112.80 with support at $97.94.
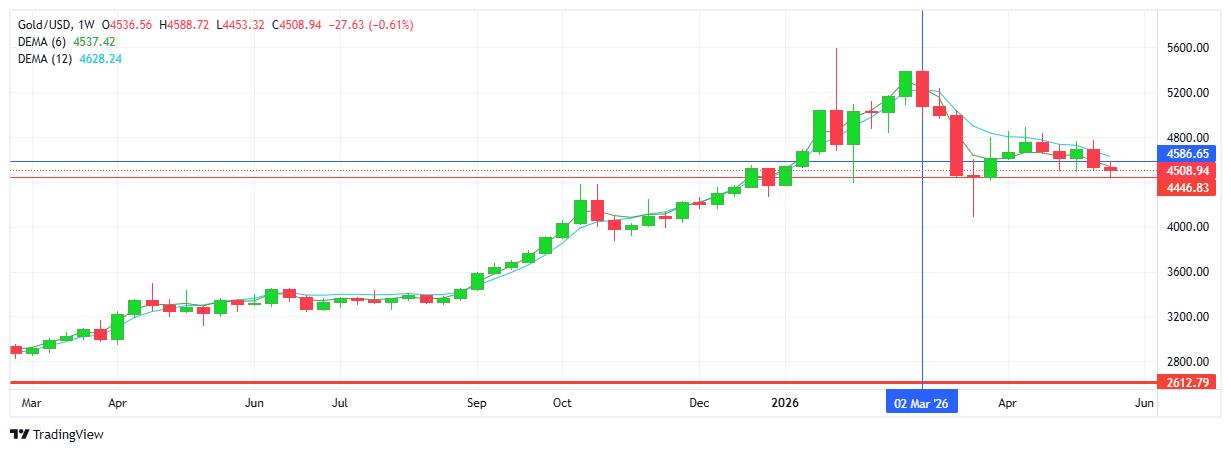
BITCOIN
Sellers won out on the week, plus a lower high and lower low on the chart. Although the EMAs reflect the uptrend remaining intact, bias and sentiment feel lower. Also note the daily charts reflect a downtrend (EMAs crossed down). A narrow range continues with neither side able to do enough to break out. Buyers defend $74K while sellers guard $78K on the upside. Sellers may look at the (almost) double-top at $82.4K as a lower high; buyers could well see the weekly low at $74K as a higher low. Resistance at $77.8K with support at $74.1K