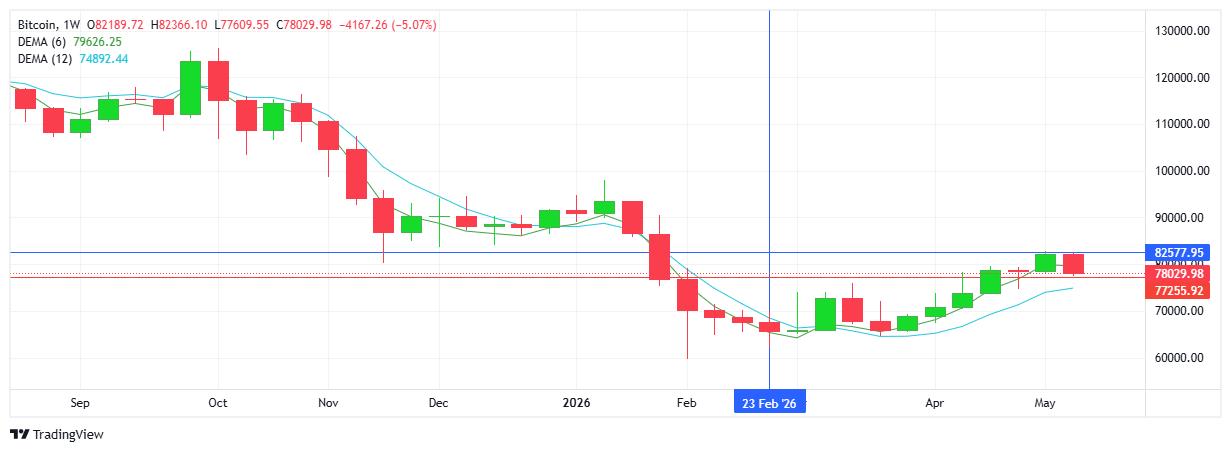
USD INDEX
A strong week for the USD as buyers confirmed demand for the world’s global currency. Hot inflation data contributes to Fed turning bullish, high yields attract investors, and the safe haven asset draws appeal as geopolitical conflicts show little in terms of an optimistic outcome. Resistance at 99.22 with support at 97.68.
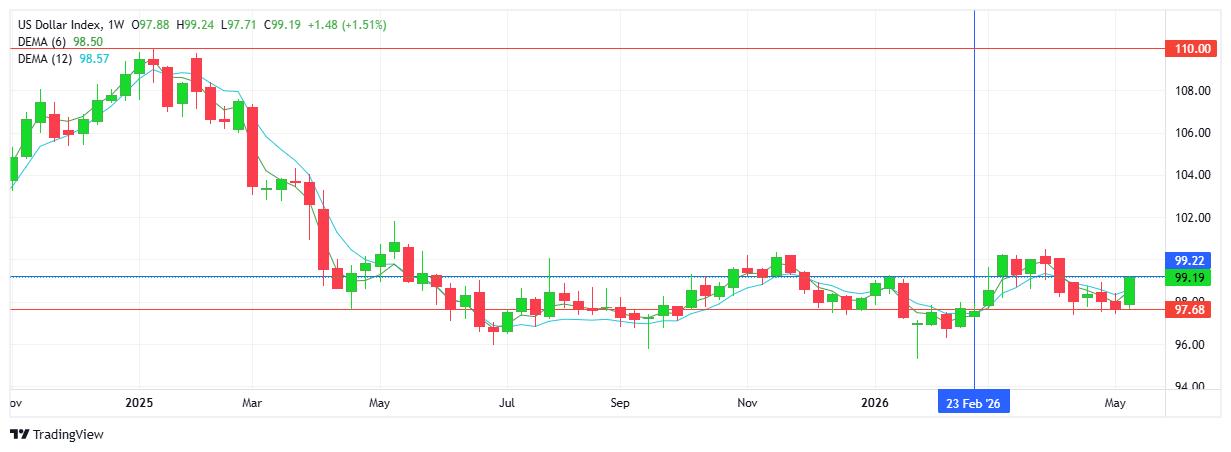
S&P 500
Notwithstanding Friday’s retracement which saw sellers end the week with a not unexpected bout of profit-taking, the chart confirms the demand for US stocks. Last week saw yet another record high on the index with a 7th consecutive green candlestick and a succession of higher highs and higher lows. Strong earnings from the tech sector (with AI leading the way) added to the positive sentiment and FOMO amongst traders/investors. Noteworthy that the USD and equities moved in the same direction (higher) rather than the traditional inverse relationship. Resistance at 7535 with support at 7364.
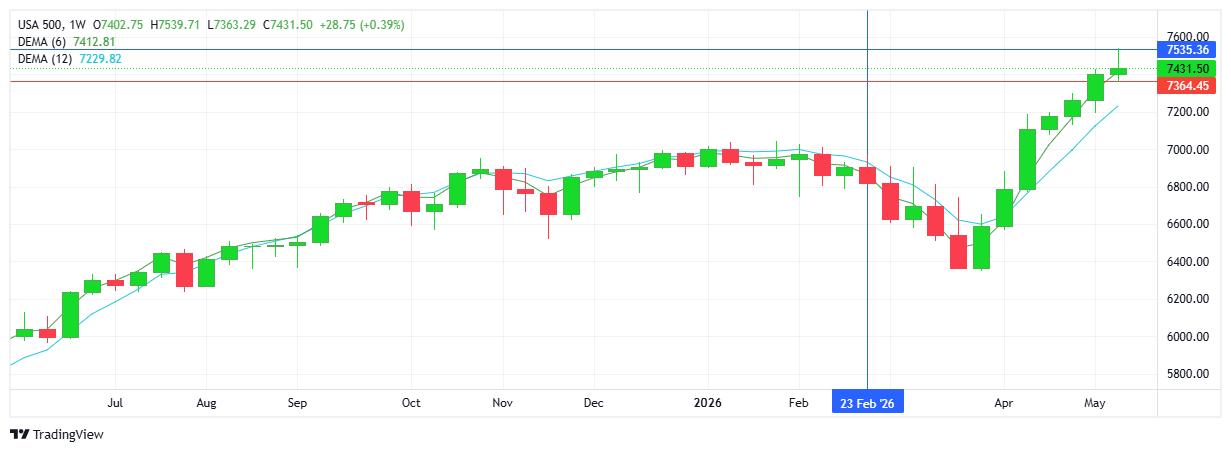
GOLD
Selling pressure won out this week with a break below the support of the descending triangle formation (bearish signal). Price activity moved well below the $4700 comfort area which held early in the week. A hawkish Fed and rallying USD eventually proved too much for the metal to hang tough. While sellers target below $4500, buyers look up to retake $4600 as a minimum in order to halt and then reverse the trend. Resistance at $4773 with support at $4530.
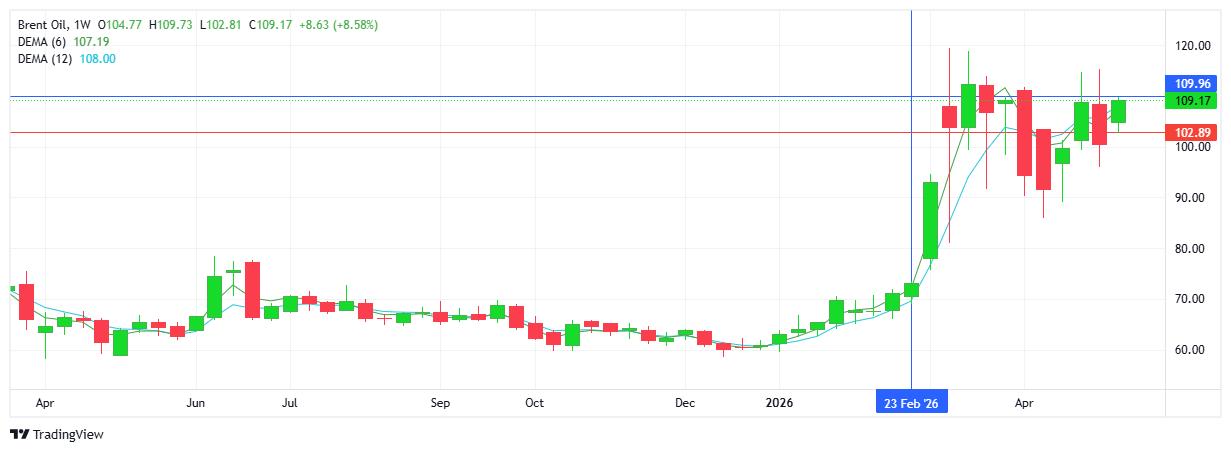
BRENT OIL
Last week saw no new developments on the oil front, with status quo reflected in prices edging close to the $110 level going into the new trading week. US and Iran no closer to an agreement, the straits closed, or at least not open for safe passage, and hearing number like $120, $150 and $200 being thrown around - all contributing to a very uncertain market. Resistance at $109.96 with support at $102.89.
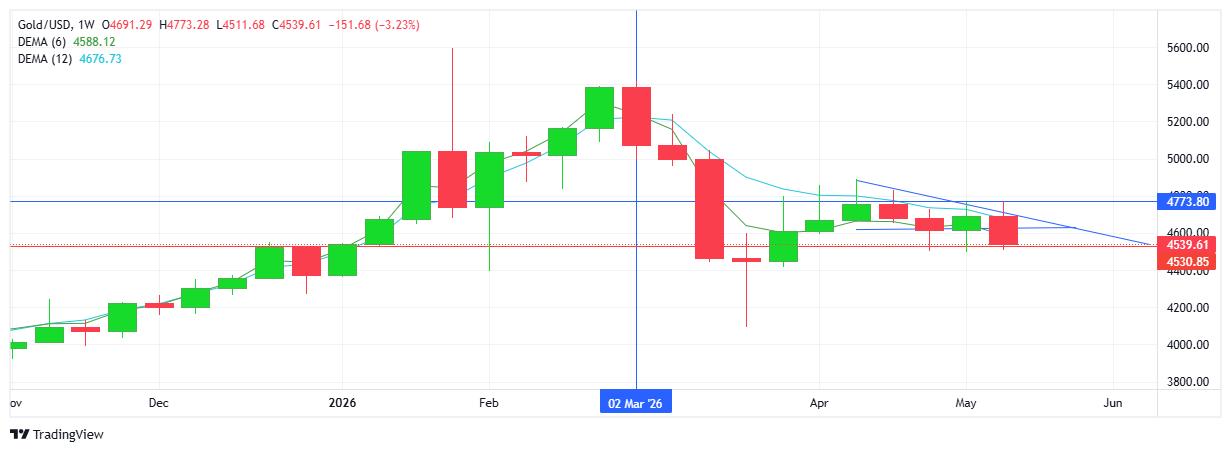
BITCOIN
Buyers were unable to add, or even hold on to the $80K - $82K resistance as sellers controlled the week’s activity reversing the trend on the dailies. Noteworthy that the weekly candlestick confirms prices closed below the leading MA as well as closing with a lower low on the chart. Sellers will look to add to the sell-off and move further below the $80K mark, while buyers look above the same level in order to retest the $82K resistance area. Resistance at $82.5K with support at $77.2K.