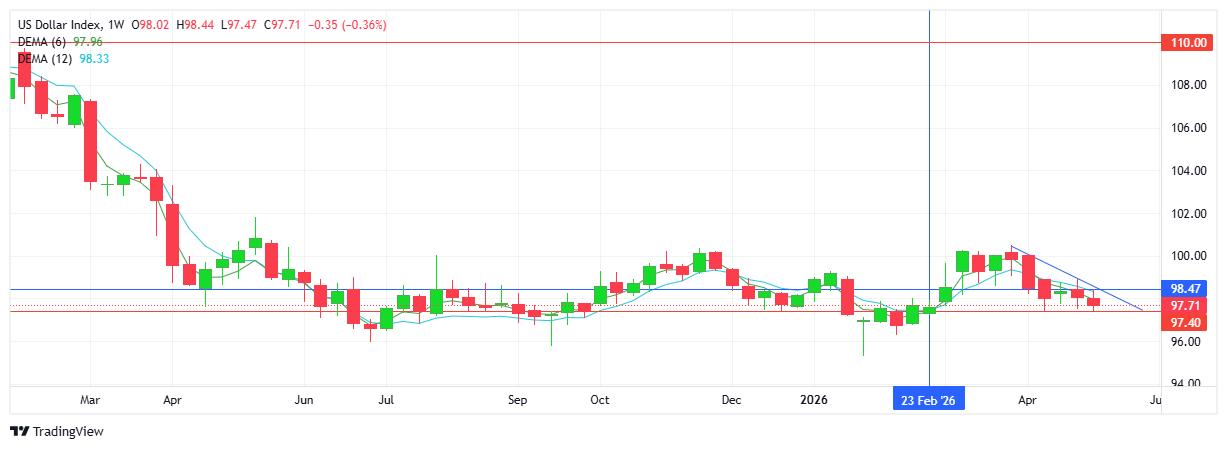
USD INDEX
The bearish bias and negative sentiment surrounding the world’s reserve currency continues with another red weekly candlestick adding to the downtrend (5 of past 6 weekly candlesticks are red). Current support level again successfully guarded by buyers, for now. Note the descending triangle formation - bearish signal. While sellers target below 97.00, buyers look up to regain 98.00 on the upside. Resistance at 98.47 with support at 97.40.
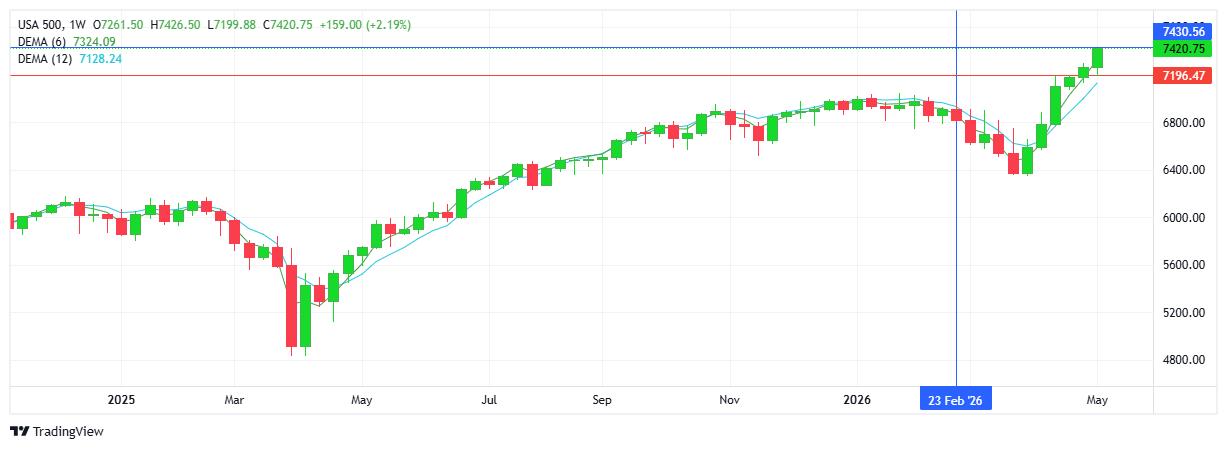
S&P 500
Demand for US equities reflected in the index recording another strong week, with a record high on the index. The chart reflects a 6th consecutive green candlestick with higher highs and higher lows confirming the uptrend. The risk-on theme aided by a less than hawkish Fed, strong earnings reports, and investors not wanting to miss out on the rally. Resistance at 7430 with support at 7196.
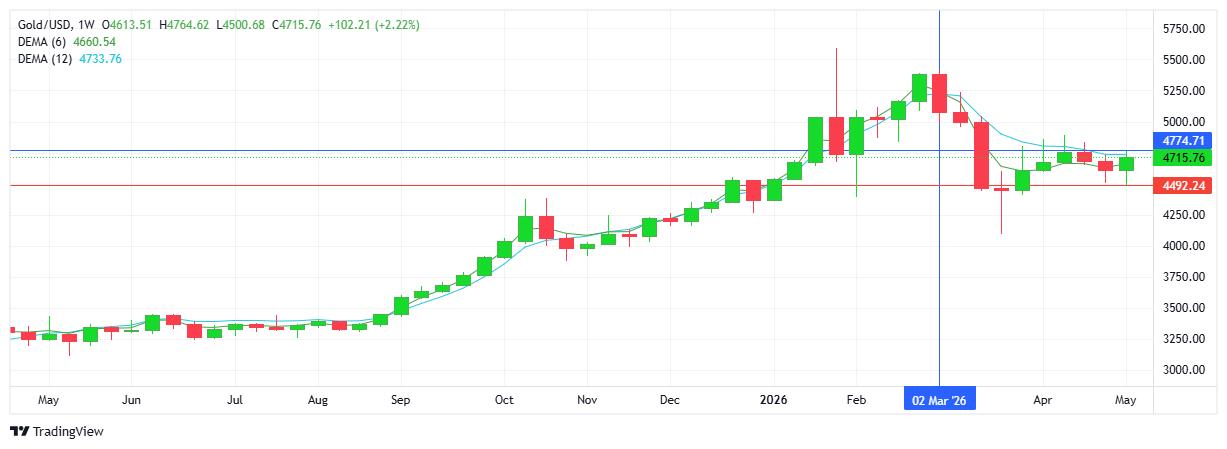
GOLD
The safe haven commodity appears content to be staying out of the limelight for now. The end of the historic bull run coincides with the start of the middle east war (Feb 27th). Technically the downtrend remains intact, although practically the metal continues to range within a loosely formed sideways range between $4500 and $4700. Gold has not rallied in response to a weakening USD (traditional inverse relationship), while at the same time, sellers appear unable to break below the current support which is guarded by buyers. Resistance at $4774 with support at $4492.
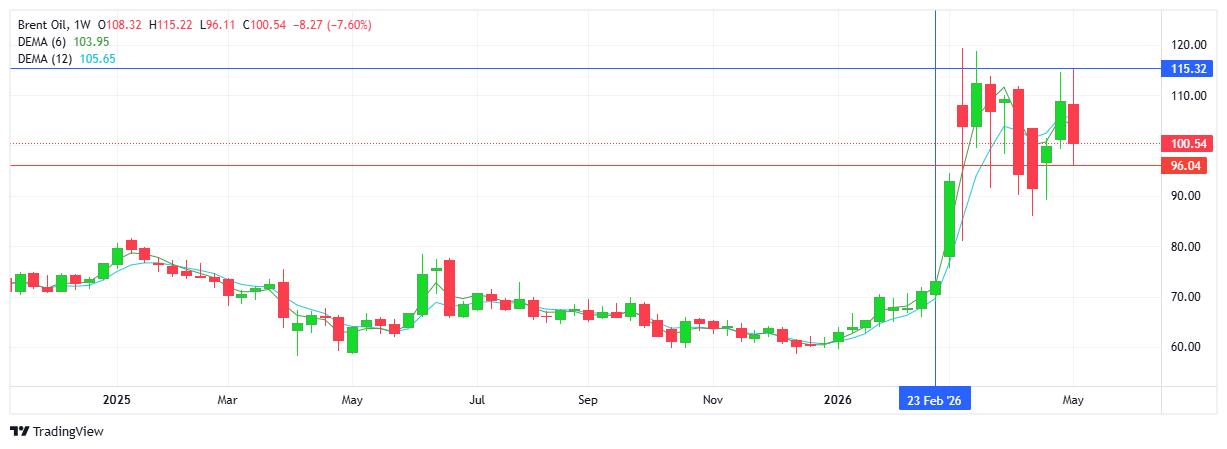
BRENT OIL
Oil will start the new week sitting nervously at the pivotal $100 mark. US optimism for a deal moved prices down from the $110 area and below $100, while Iran standing steadfast in their “non acceptance” creates a pessimistic view for potential spikes back to the $110 - $115 area. The straits of Hormuz remain closed for practical purposes - instrumental in tilting the bias/price to the upside. Resistance at $115.32 with support at $96.04.
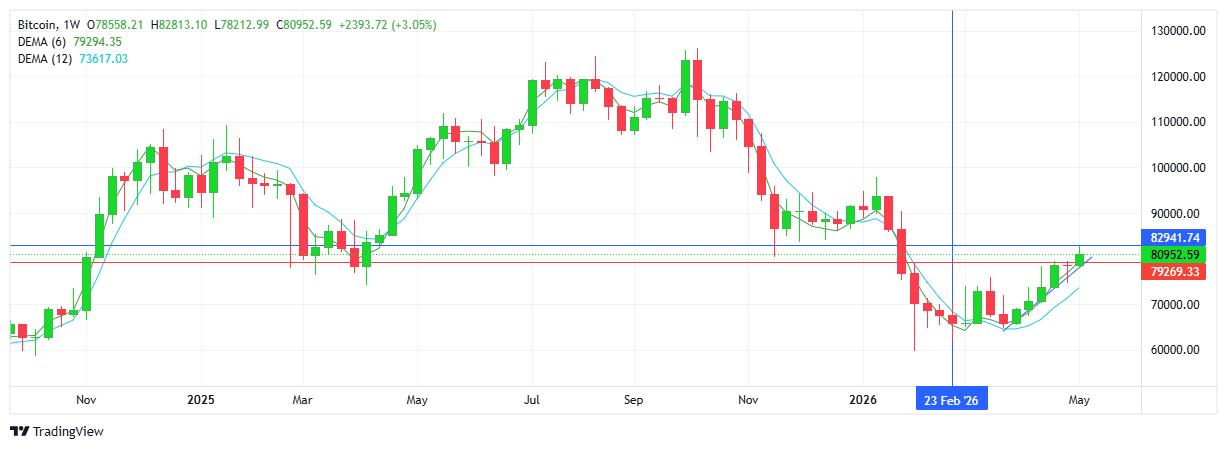
BITCOIN
Buyers maintain control and extend the uptrend. Classic higher highs and higher lows on the chart. Buyers continue to struggle above the $80K mark. Sellers have not stepped in since the uptrend started ($65.6K) at the end of March 2026. Sellers aim below $78K as a first step in reversing the trend. Resistance at $82.9K with support at 479.2K.