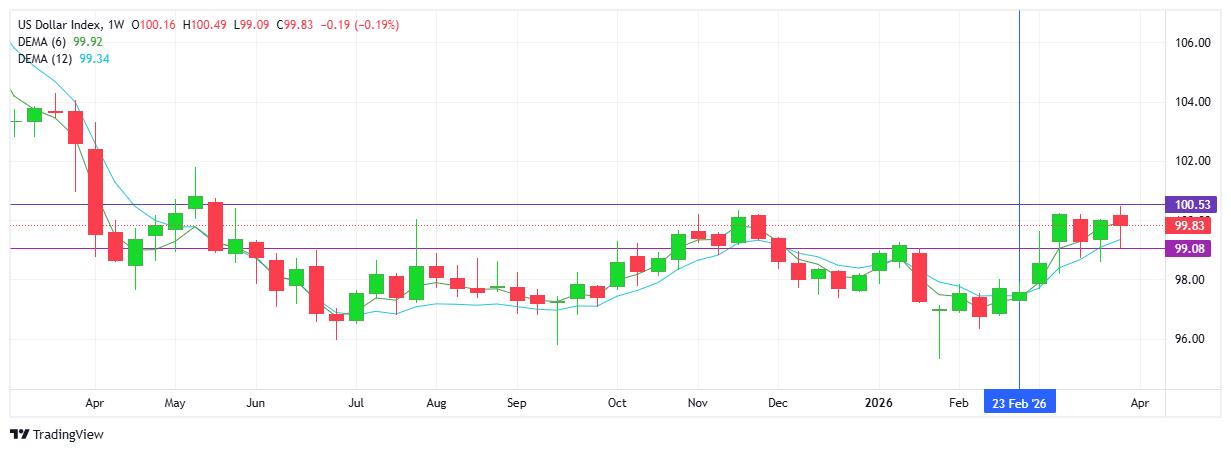
USD INDEX
A volatile and undecided week for the global currency which saw sellers step in on the prospect of hope and a potential settlement in the middle east conflict, however renewed aggressive rhetoric quickly saw the USD rally to close the week. The uptrend remains intact. Noteworthy is the bearish engulfing candlestick on the dailies which confirmed the reversal, as well as current price sitting below the relevant 100.00 mark. Resistance at 100.53 with support at 99.08.
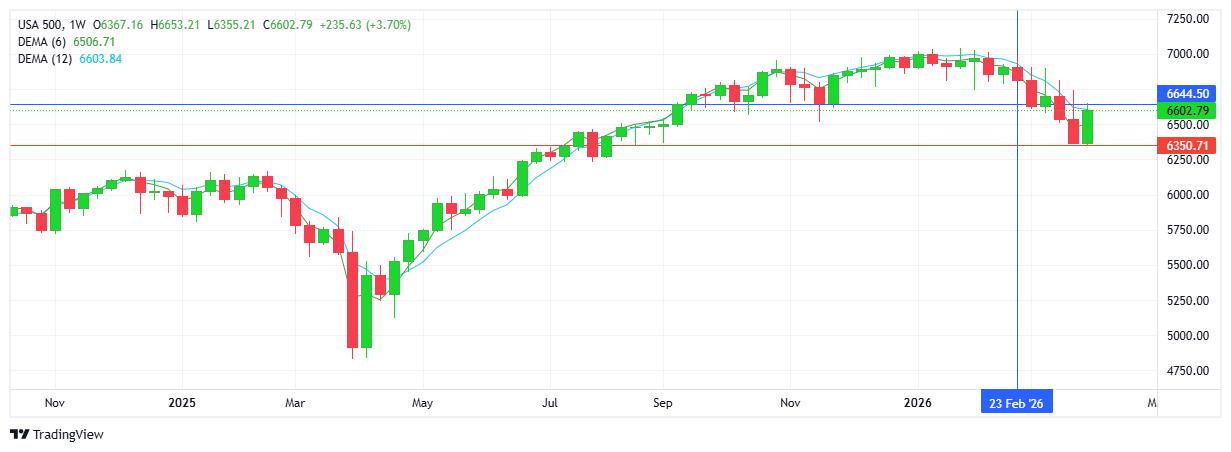
S&P 500
US equities had a strong week with the index confirming demand and buyers maintaining control throughout the week. Notwithstanding the solid green candlestick, the charts reflect a lower high as the downtrend remains intact. Buyers look up to 6700 as the next upside target. Resistance at 6644 with support at 6350.
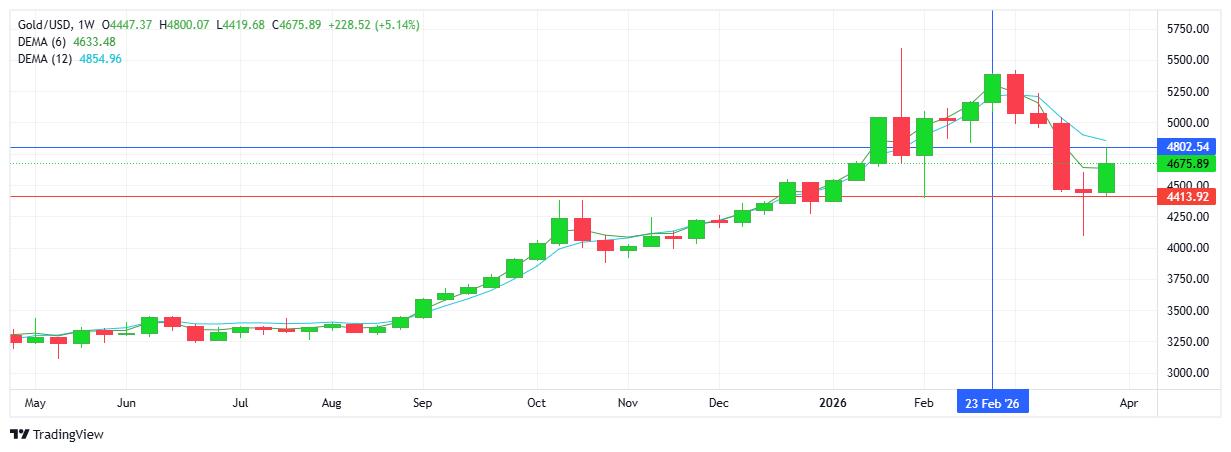
GOLD
The metal continued its bounce up off the $4100 support from last week as buyers maintained control with a solid green candlestick breaking the previous 4 successive red candles on the weekly chart. Note the higher high and higher low adding to the bullish feel. However, the downtrend does remain in place. (The daily chart does reflect a double top/reversal down at the close of the week). The safe haven commodity has shown resilience in the face of a strong USD. Buyers will continue to aim for the $5000 level on the upside. Resistance at $4802 with support at $4413.
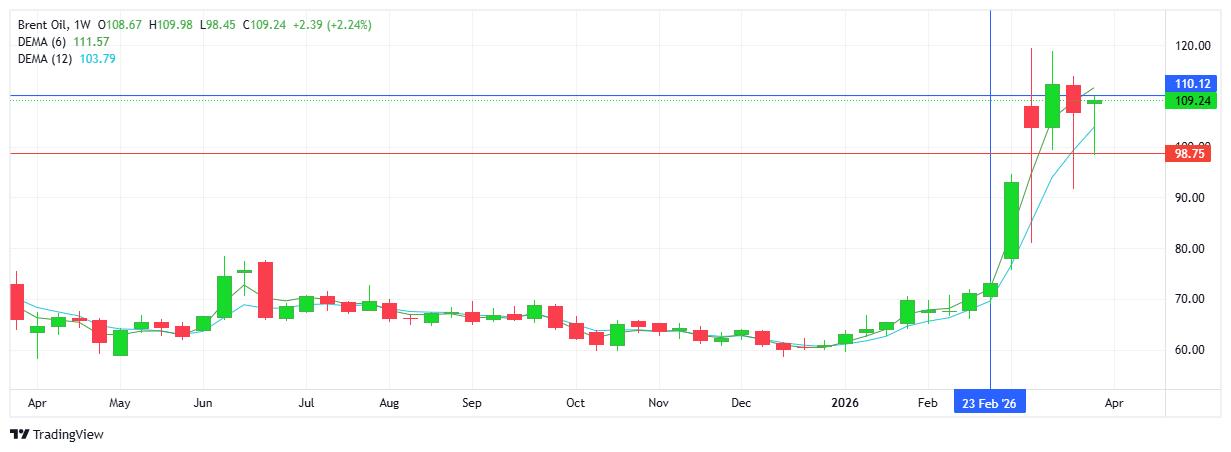
BRENT OIL
A brief push lower in the hope of a peace settlement being reached, or at least some form of ceasefire, was short lived. Prices remain well above the $100 mark as the market appears to be in repricing mode as the reality of an extended supply shortage looks to be a realistic outcome of the ongoing middle east conflict. With the uptrend in place, the current “comfort zone” is shaping up around the $110 area. While intraday volatility does not have relevant, or specific price levels to work with, it does feel like some kind of permanent peace deal will be needed for prices to return to under the $100 mark. However, threats of escalating the current climate, from either side, makes upside spikes the more likely scenario. Resistance at $110.12 with support at $98.75.
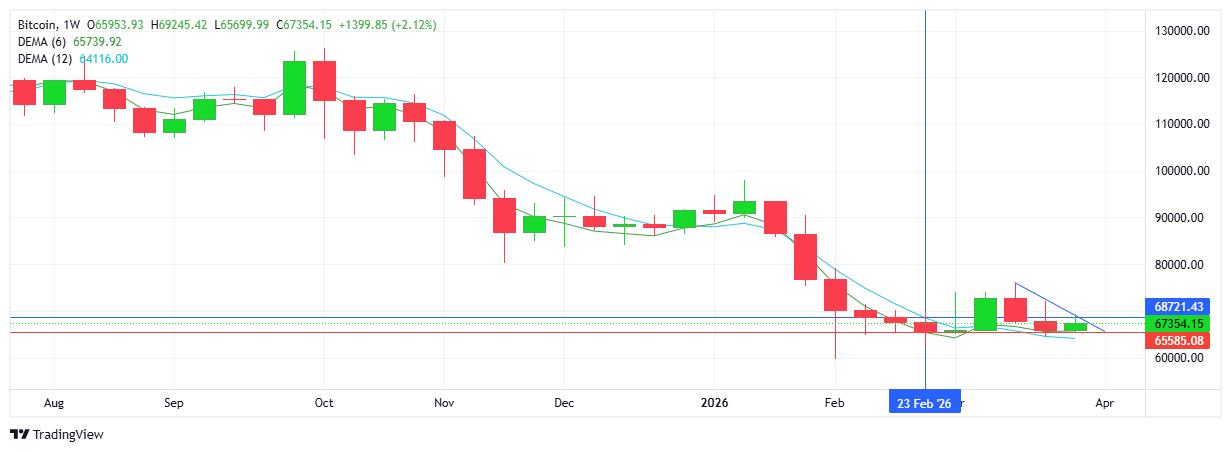
BITCOIN
The green weekly candlestick on the charts does confirm a higher close, but little else feels bullish about the cryptocurrency at this point. The trend remains down, a lower high on the chart, and the descending trendline capping moves to the upside. However, note the very strong support which buyers have guarded successfully since the start of 2026. Sellers will also see the descending triangle formation which indicates the base of the triangle (support) may eventually be broken with the sustained downward pressure. Resistance at $68.7K with support at $65.5K.