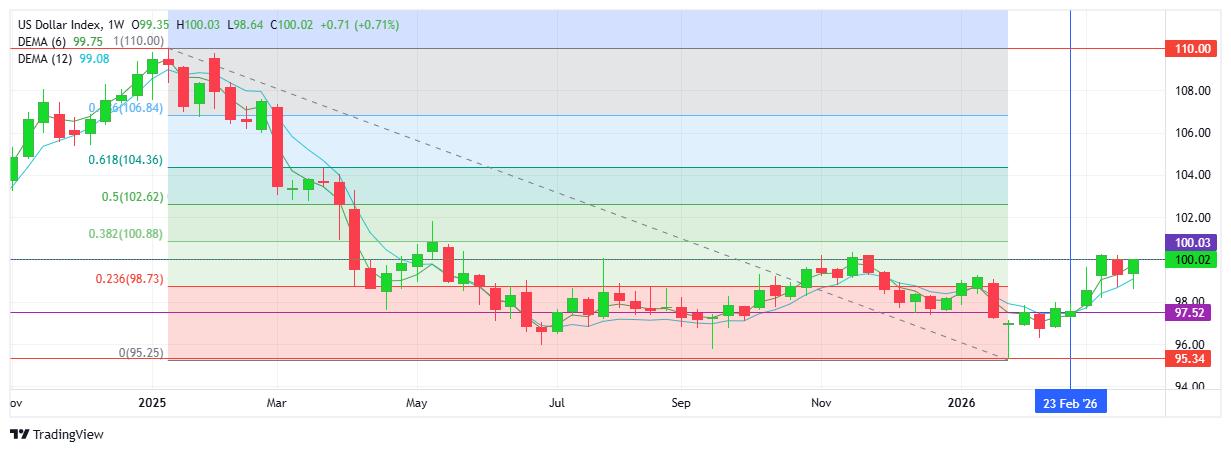
USD INDEX
A strong week for the global reserve currency with demand for USD across the board. Buyers erased last week’s sell-off and is once again ready to test the 100.00 level. Liquidity, safe haven asset, oil over $100 with global growth concerns, all contributing. Note the first fib retracement test at 38.2% (measuring the 2025 sell-off) sits at $100.88 on the upside. Sellers look down at 99.00. Resistance at 100.03 with support at 98.64.
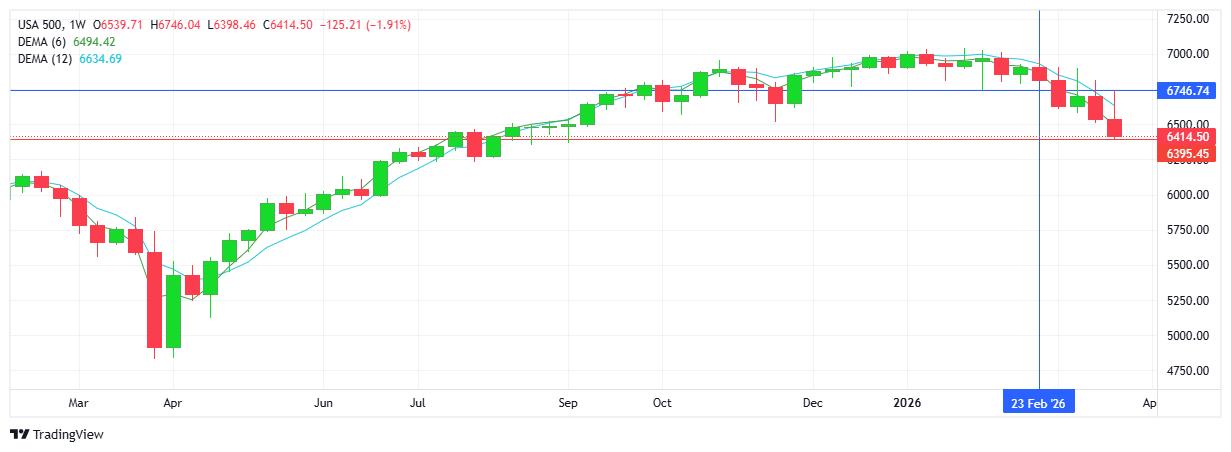
S&P 500
A strong USD and weak equities is the traditional inverse relationship. All the fundamentals lined up - geopolitical shock as the Iran/US war continues, inflation concerns led to Fed/interest rates taking cuts off the table, tech/AI related stocks gave way, all contributed. Note the succession of lower highs since the 7000 resistance at the start of the year, picking up steam since the start of the war Feb 27th. Resistance at 6746 with support at 6395.
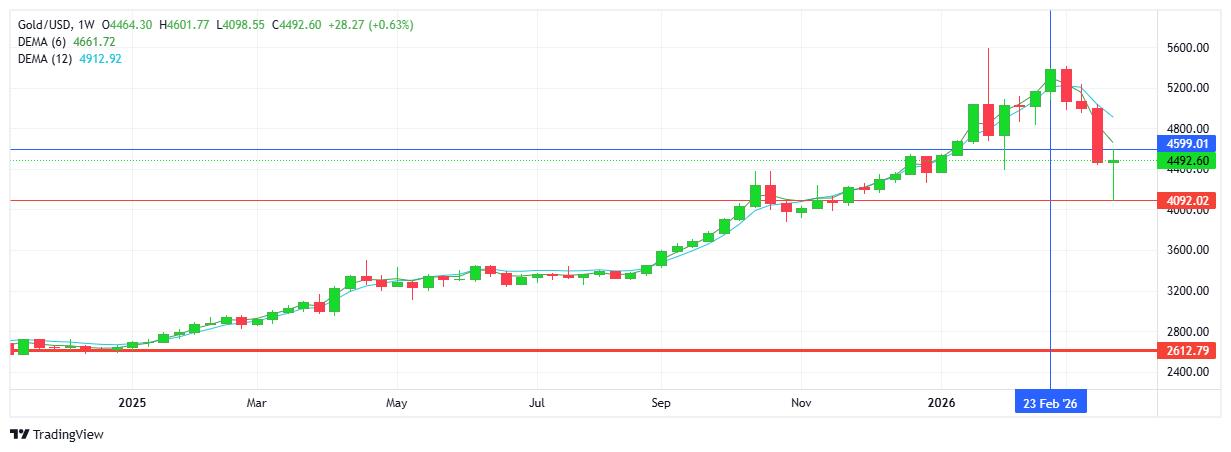
GOLD
Although buyers won out over the week, the downtrend remains intact with the safe haven commodity unable to compete against a strong USD. Buyers did step in at the $4100 support area, managing to close the week alongside last week’s close resting slightly below $4500. All be it minimal, the green candlestick with a long lower wick did break the succession of 3 previous red candles, signalling the metal’s resilience. Resistance at $4599 with support at $4092.
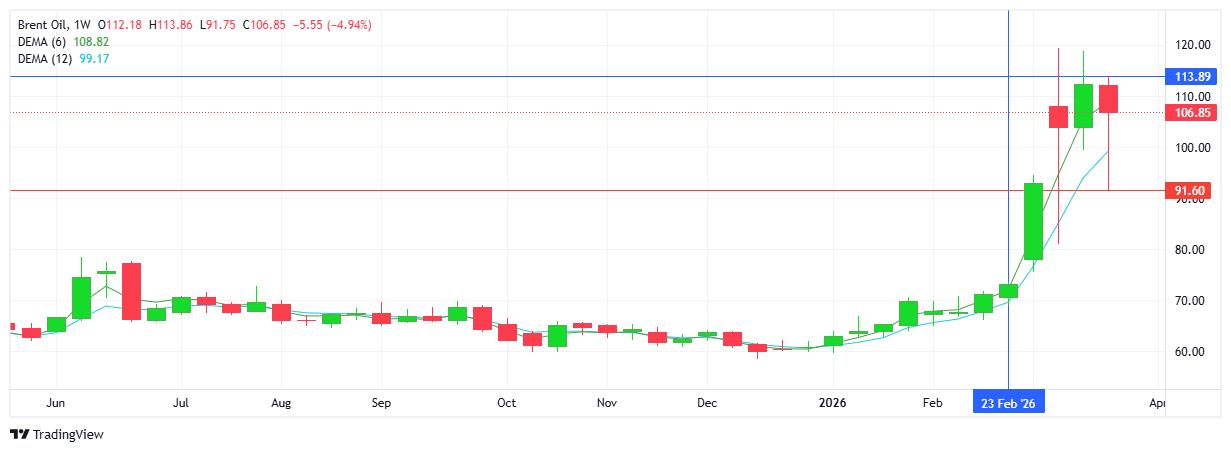
BRENT OIL
As expected, another volatile week in the oil market within a wide $20+ trading range. The theme revolved around the US talking about a settlement, or at least a ceasefire, (notwithstanding 1000s of US troops on route to the region) while Iran continues to attack gulf states in the area with little in the way of conciliatory rhetoric. And most importantly, the straits of Hormuz remain closed. The net result is prices remain comfortably above the $100 mark. The uptrend firmly intact with price levels on the upside of little significance for now, although $120 is the current resistance area. Resistance at $113.89 with support at $91.60.
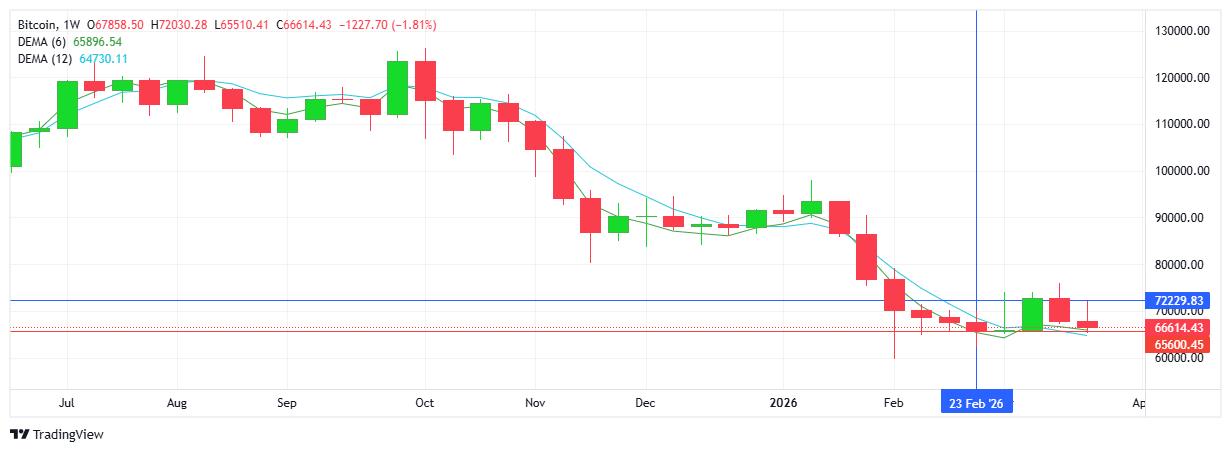
BITCOIN
The sideways activity continues with price action contained within a now familiar $6K range since the beginning of February 2026. The trend and bias point down as sellers won out on the week and in so doing closed below the $68K support which buyers had been struggling to protect. Note that aside from last week’s rally, red candlesticks have dominated the weekly chart. Buyers did try to break above the $70 - $72 resistance area, but the clear lack of demand resulted in sellers maintaining control. Resistance at $72.2K with support at $65.6K.