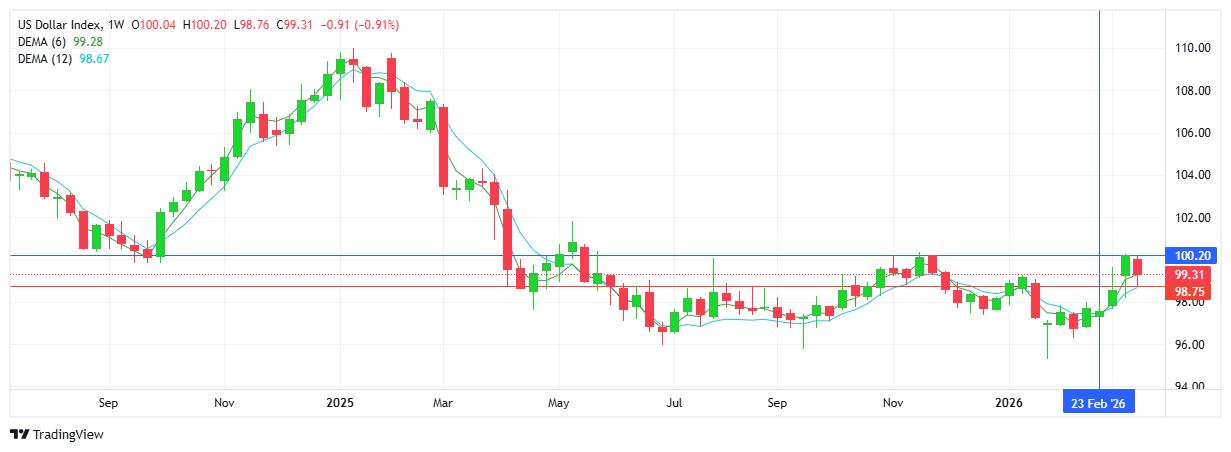
USD INDEX
Spurred on by a flight to USD safety immediately following the US/Israel attack on Iran (Feb 28th), the index rally confirmed demand for the global reserve currency. However, as the war enters it’s 4th week the chart reflects a sharp pullback as sellers entered the picture with a steep sell-off. As has been the case since May 2025, buyers have been unable to maintain above the 100.00 mark. Resistance at 100.20 with support at 98.75.
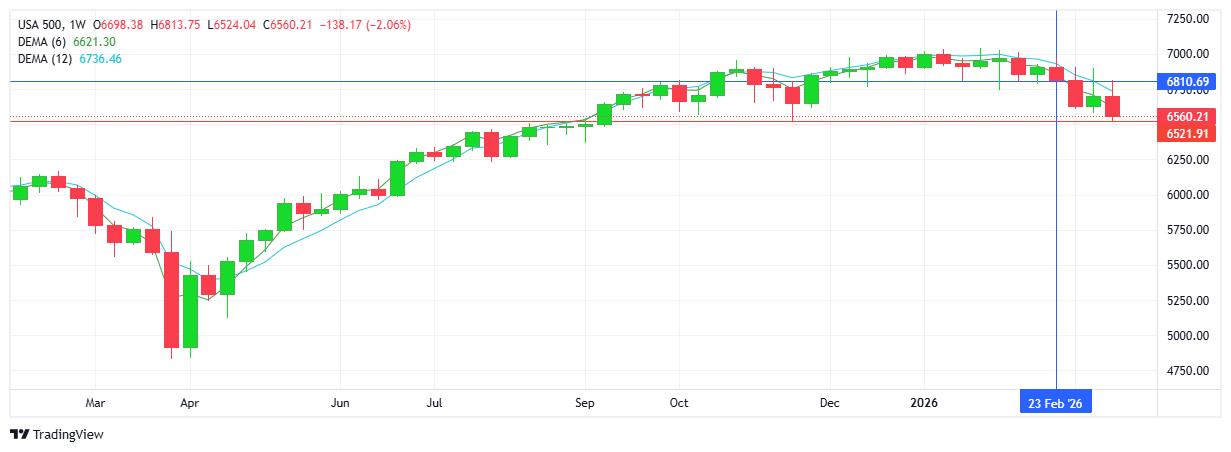
S&P 500
Sellers added to the pre-existing downtrend as equity markets react to the oil crises and potential economic slowdown. A strong USD, as well as the Fed’s bullish rhetoric when holding rates steady at the FOMC last week, all did little to create demand for US equities as stock markets trade nervously. Technically a 4th consecutive lower high and lower low confirm the bearish sentiment. Note the support matches that from November 2025. The 6800 resistance shapes up as a pivotal level for buyers to target. Resistance at 6810 with support at 6521.
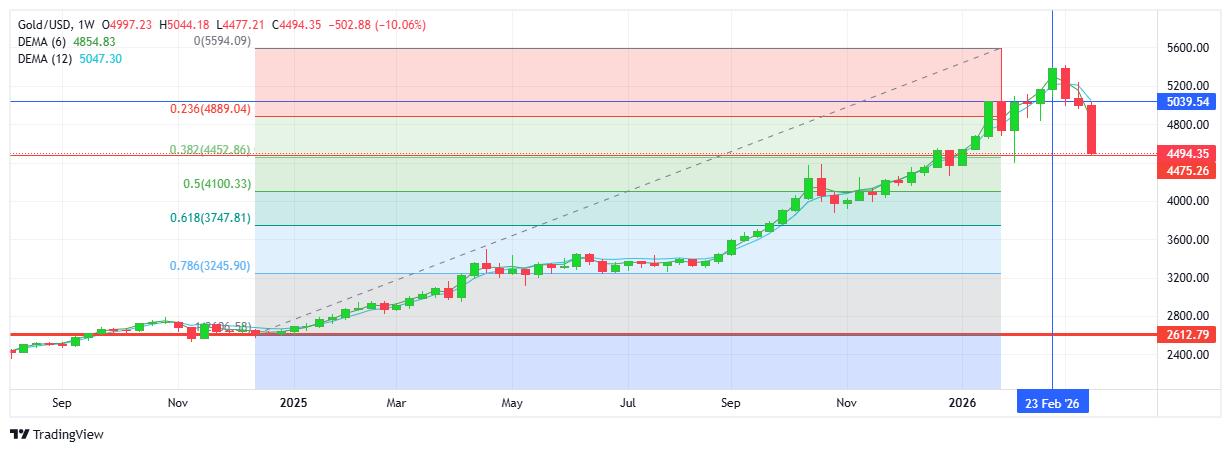
GOLD
Perhaps the most surprising economic response to the middle east war has been gold’s sharp sell-off. Traditionally regarded as a safe haven commodity in times of geopolitical conflict, the metal has instead seen little demand as sellers have gone on to record extreme moves lower, breaking below significant support levels with relative ease. Measuring the 2025 rally from $2600 up to $5600, note the first fib retracement level (38.2%) sits at $4450, ie. $50 below the current $4494 price. Should the USD struggle to maintain strength, a weakened dollar, technically and from a sentiment perspective, could provide gold with the impetus to reverse the current trend. Resistance at $5039 with support at $4477.
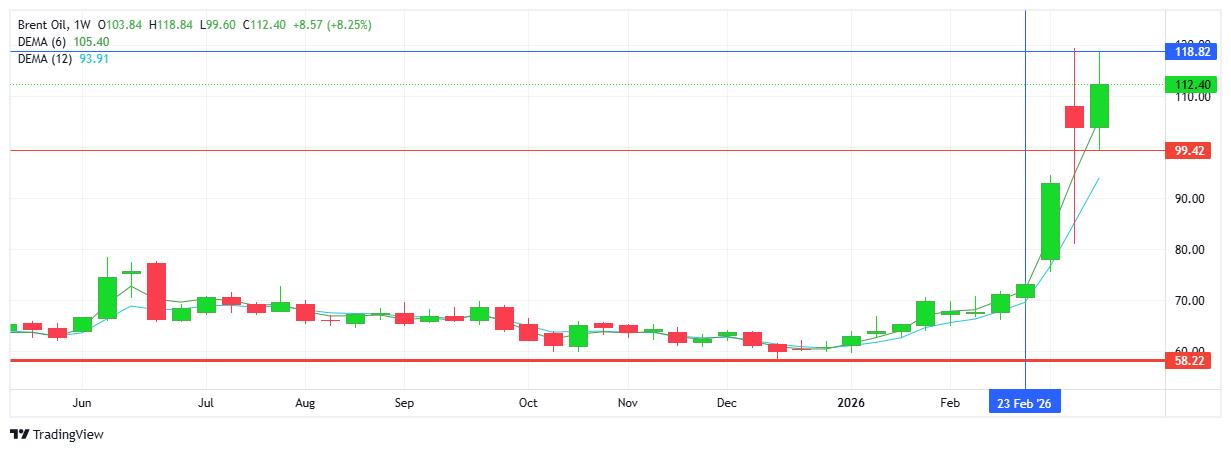
BRENT OIL
Wild swings to the upside continue as prices fluctuated within a wide, volatile $19+ range. The lower highs confirm the upward bias as uncertainty and worst- case scenarios dominate price activity. The 2 contributing factors affecting price show no signs of alleviating the supply concerns - strategic supply reserves/infrastructure have been targeted throughout the region by Iran, US and Israel, and supply/shipping routes remain closed. Technical levels: prices have held above $100 over the past week; Resistance over $118 has been reached twice during the week; Next upside target is a test of $120. Resistance at $118.82 with support at $99.42.
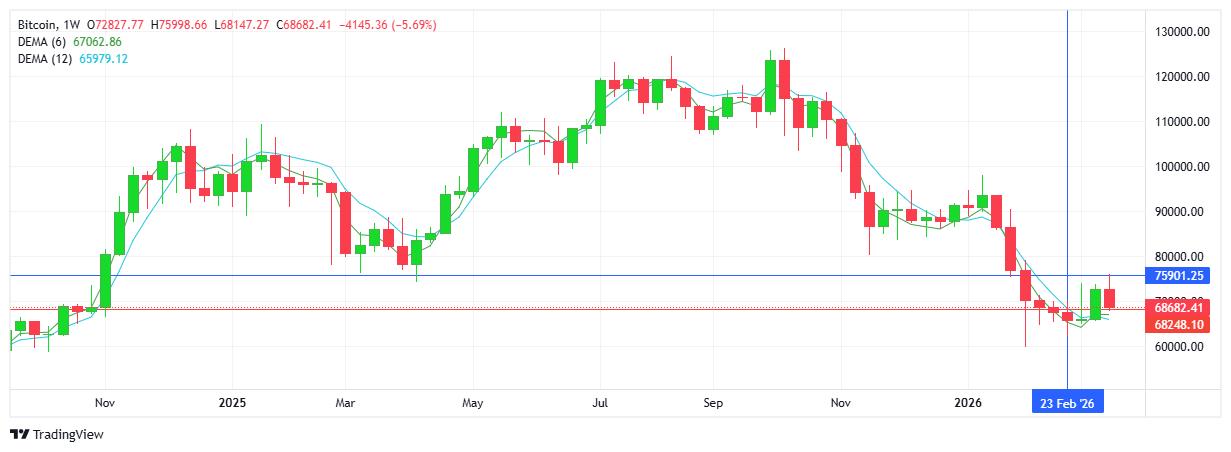
BITCOIN
While traditional asset classes have reacted with extreme volatility through the middle east war, the most stable and seemingly unaffected instrument appears to be Bitcoin. Prices have remained flat, with a mini rally from 2 weeks ago, reversed last week, as current prices trade close to the well-established $70K area. Buyers continue to struggle above $75K, the level being guarded by sellers. On the downside buyers have protected the $68K - $70k support area. Sellers may see the weekly resistance as a lower high, giving the chart a bearish feel. Note current resistance matches the April 7 2025 support - adds to relevance of the level. Resistance at $75.9K with support at $68.2K.