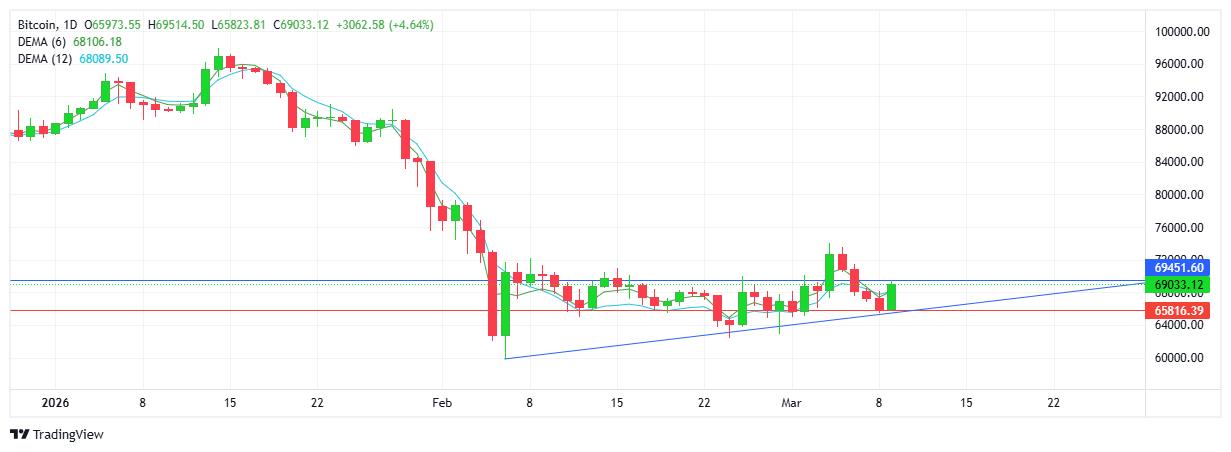
USD INDEX
Today exposed the volatility and fragility of financial markets in times of war. The index gapped higher to start the week, yet within hours of the Asian session opening, sellers stepped in and sold off sharply through the European and US sessions. Noticeably, today’s close lies alongside that of Friday. Next downside target sits at 98.00, which could be relevant looking forward as that level matches the ascending trendline which has been in place since January 28 2026. Resistance at 99.44 with support at 98.44
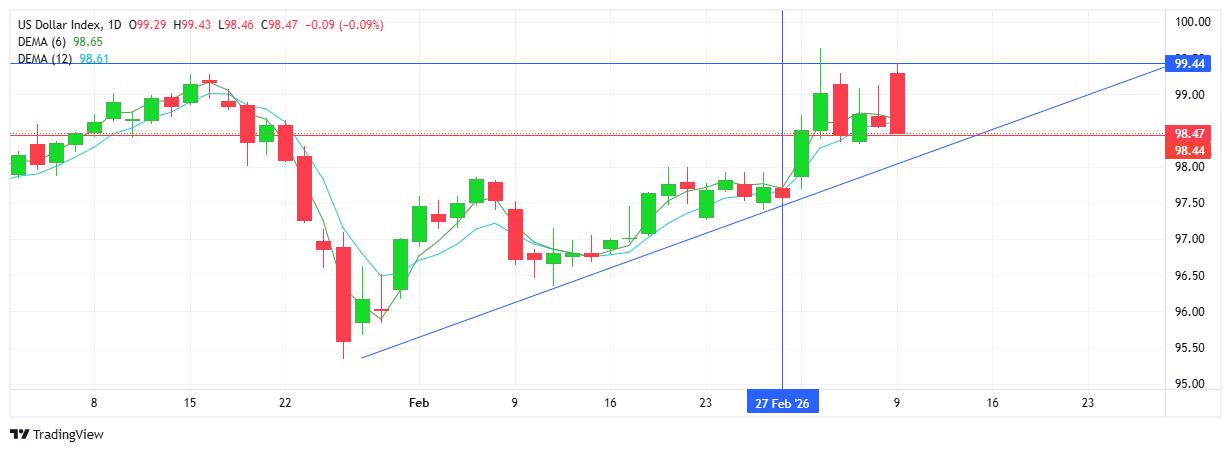
S&P 500
In sharp contrast to the USD reversal downward, equity markets reversed upward as the 2 major assets confirmed their inverse relationship. Following the gap lower in futures trading, the index rebounded before the European session got underway, led by the tech sector rally which bounced up off the 6600 area, support level which continues to be guarded by buyers, for now. Note the descending trendline which protects the downside, with the 6900 level matching the barrier. Resistance at 6815 with support at 6584
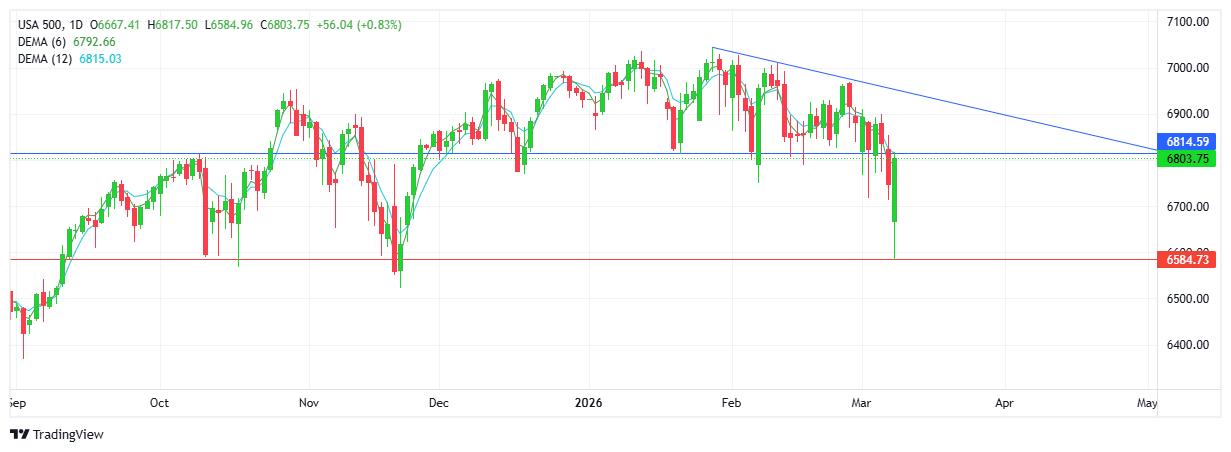
GOLD
An early gap down followed by limited follow through, buyers stepped in and insured gold recouped losses and went on to close up on the day. Notwithstanding the green candlestick, the chart does reflect a lower high as the downtrend remains intact. Note the $5000 support held strong, a level which coincides with the ascending trendline which has been in place since February 3rd 2026. Buyers aim to maintain above the $5100 mark. Resistance at $5144 with support at $5015
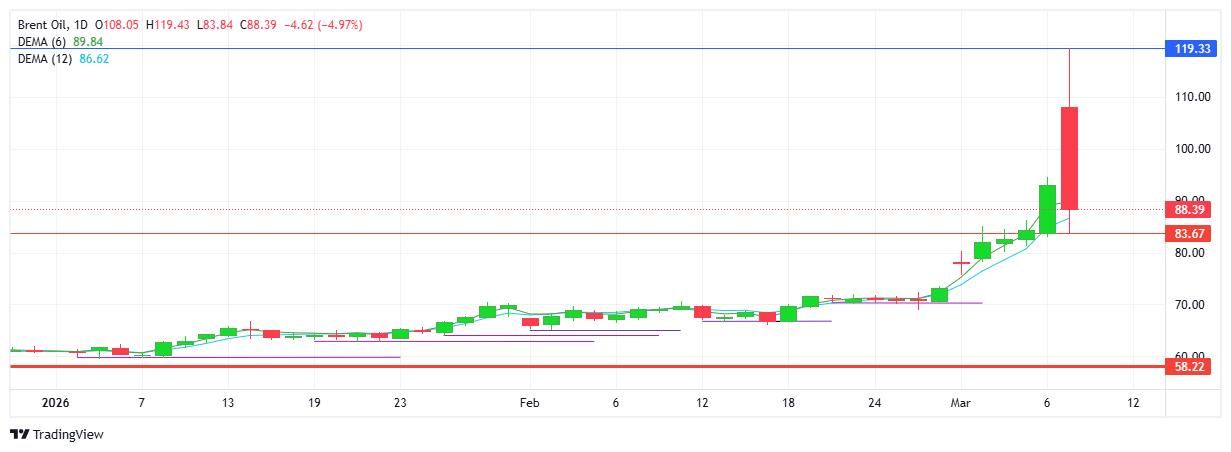
BRENT OIL
Oil rallied sharply to open as the fundamentals remain unchanged with heightened supply concerns. A change of tone with Trump suggesting the war could be reaching an end was enough for the oil market to act on the positive rhetoric. Today’s daily range was $35, with prices closing lower to end the day. Volatility and sharp spikes expected to continue with new developments at every turn. Resistance at $119.33 with support at $83.73
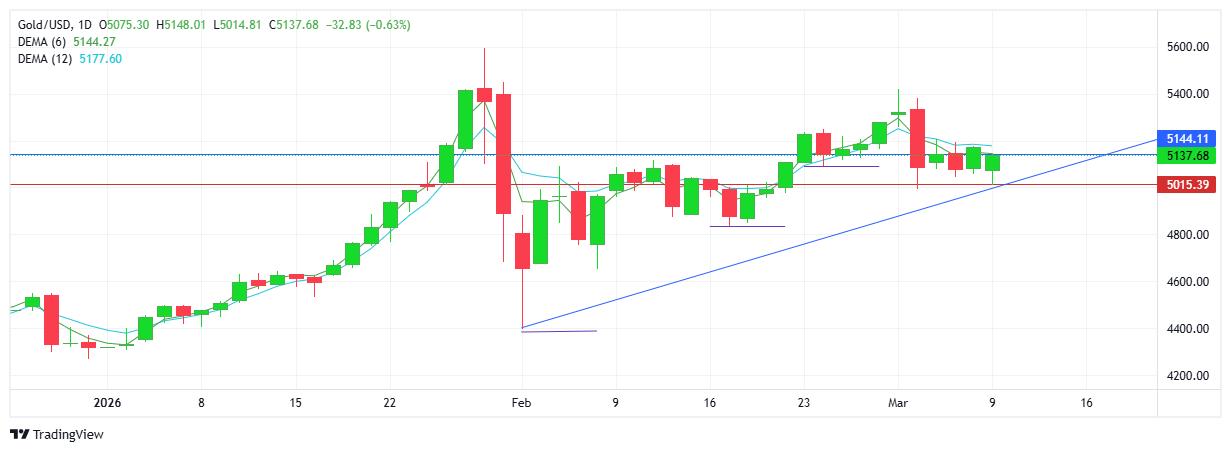
BITCOIN
Buyers took control from the open and went on to erase weekend losses and record a solid green candlestick on the chart. While today’s push higher was enough to signal a new uptrend, practically price action remains contained within the month-long sideways trend between $65K and $69K. Note the loosely formed ascending trendline which may tilt the bias upward, again. Also the 65K support area continues to be protected by buyers. The upside target remains a break above $70K. Resistance at $69.4K with support at $65.8K