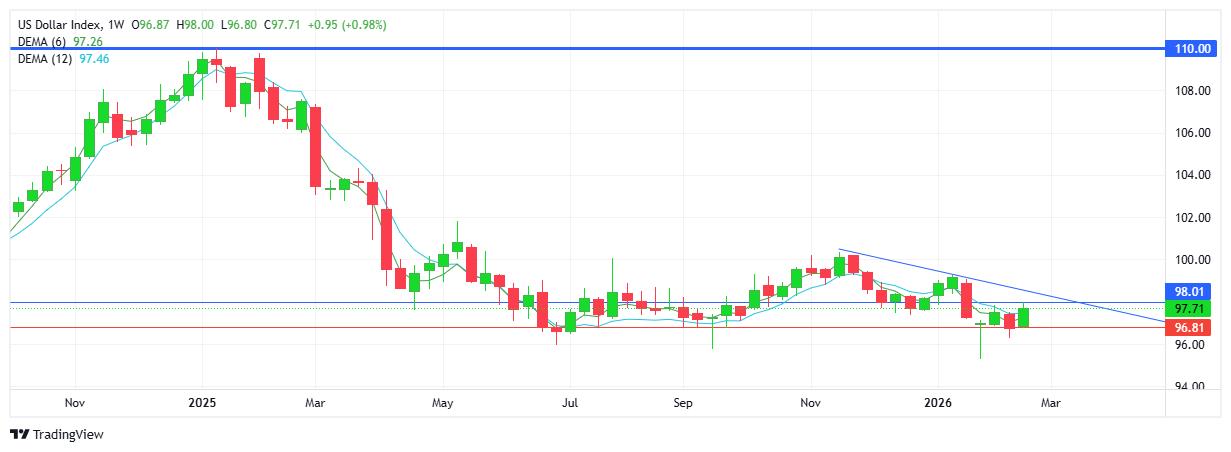
USD INDEX
Price action contained between 97.00 and 98.00 and a close within that range for the 4th consecutive week. The EMAs hanging onto the downtrend, although the green candlestick does reflect a higher high and higher low on the chart. Note the descending trend-line from November 2025. With labour and inflation data tilted positively, technicals appear to be tilted downward. Sentiment could tip the scales and a potential strike on Iran may favour the upside as the USD maintains its global reserve currency status in the face of a global conflict. Resistance at 98.01 with support at 96.81.
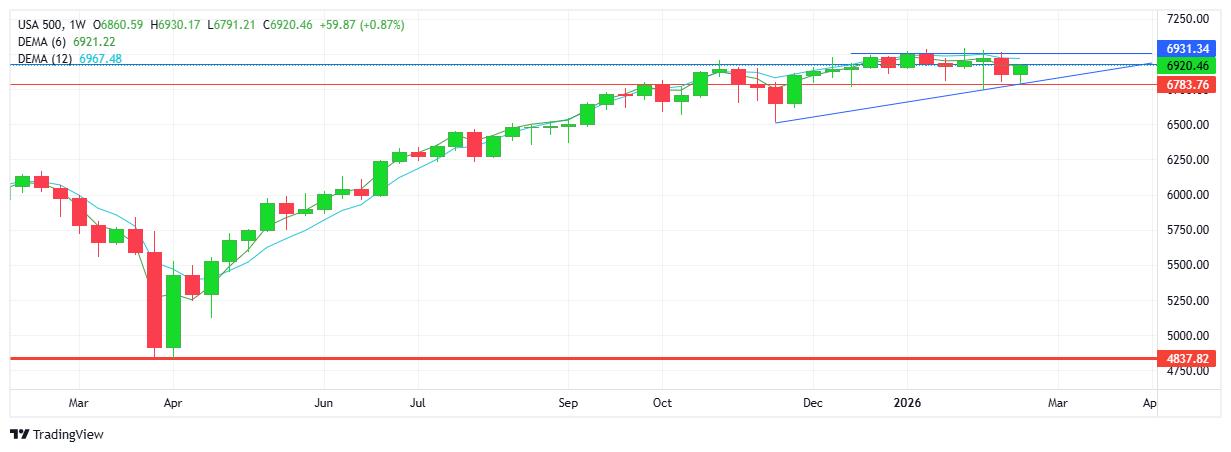
S&P 500
While buyers closed the week on the front foot, confirming a green weekly candlestick, the index continues to trade sideways with EMAs running parallel since the start of the year. Intraday moves have been volatile with regular reversals through the US session. The range remains contained between 6800 and 6900 for the most part. Buyers have been unable to maintain above 7000, continuing to step in below 6800. Note the potential ascending triangle formation (bullish). Next week could see continued volatility as the market struggles to react to the unsettled tariff/Supreme Court ruling. Resistance at 6931 with support at 6783.
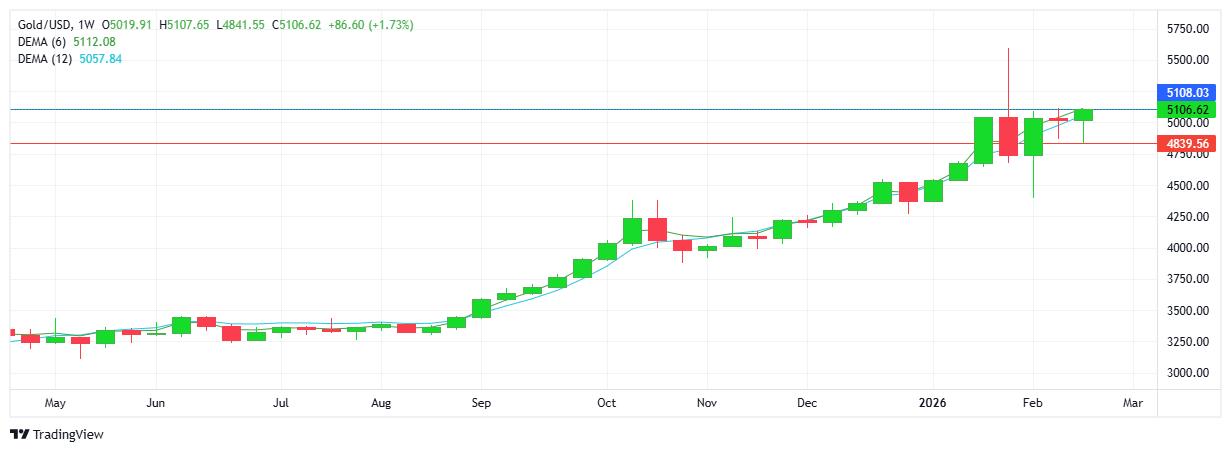
GOLD
A strong week for the metal, confirmed with an all-time high weekly close. Technically all indications confirm the strong uptrend, with fundamentals adding to the picture - US/Iran conflict and US political instability favouring demand for the safe-haven commodity. The 2 factors on the flip side point to bouts of profit taking linked to overbought technical indicators on shorter time-frames. Resistance at $5100 with support at $4839.
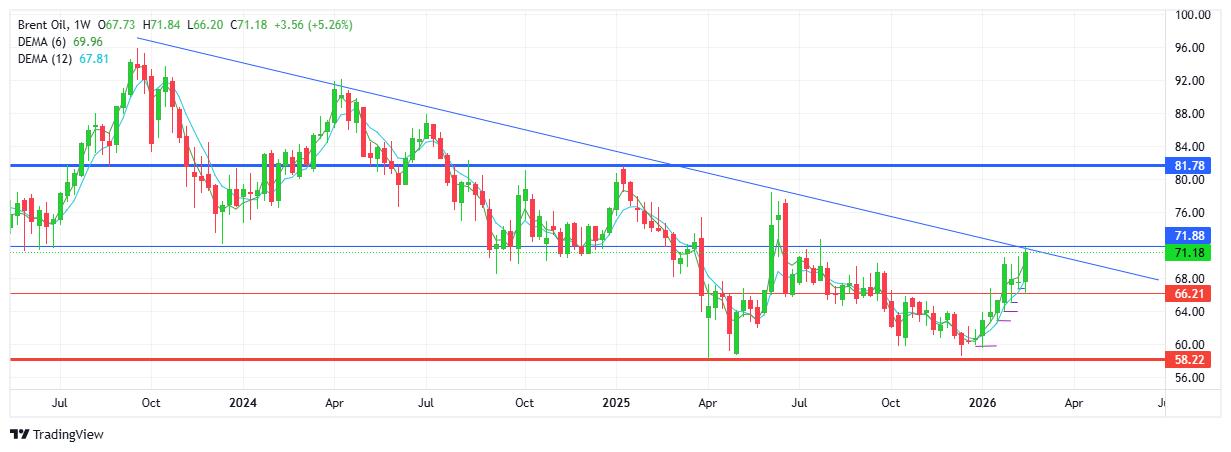
BRENT OIL
One-way traffic for now as buyers continue to confirm demand for oil in anticipation of supply concerns with the US appearing ready to attack Iran as a result of no peace deal being reached. All the activity thus far is based on threats and rhetoric, with physical action confined to US military preparations in the area. Note current resistance levels match the descending trendline which has been in place since September 2023. Also, zooming in we see the series of higher lows since the start of the year. Right now, it feels that fundamentals rather than technicals will dictate the next significant move. Resistance at $71.88 with support at $66.21.
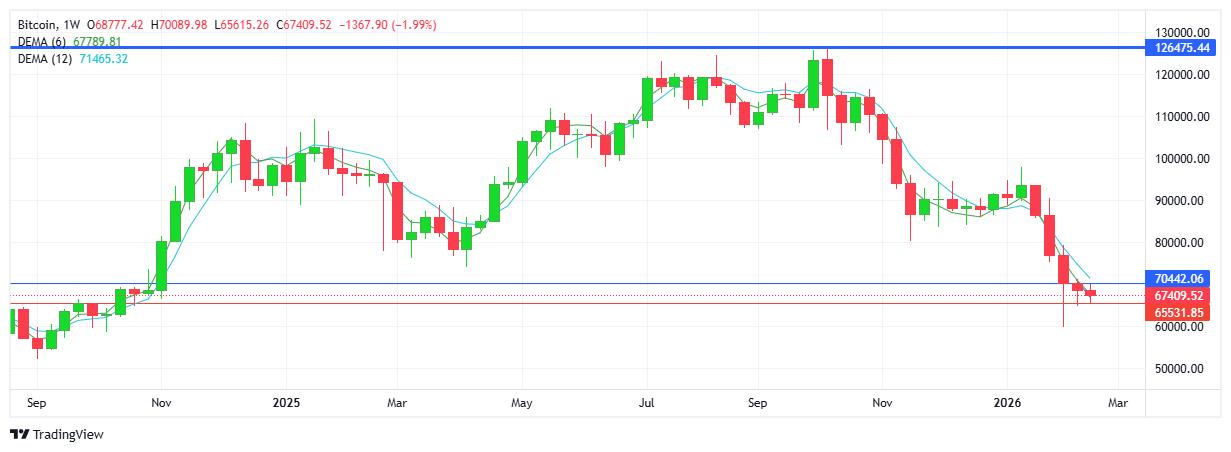
BITCOIN
A 5th consecutive week of lower highs as sellers control price action with limited demand for the cryptocurrency. The 65K level continues to be guarded by buyers, for now. However, any attempts at a correction are short-lived as the $70K area contains attempted moves to the upside. Note the weekly ranges continue to narrow, with a $5K range this week possibly preparing for a meaningful break to follow. Noteworthy that BTC continues to attract no interest from a safe-haven commodity perspective. Also, the fact that the cryptocurrency was trading above $97K at the start of the year, and now sits over $30K lower, has not attracted buyers from a “value” perspective. Resistance at $70.4K with support at $65.5K.