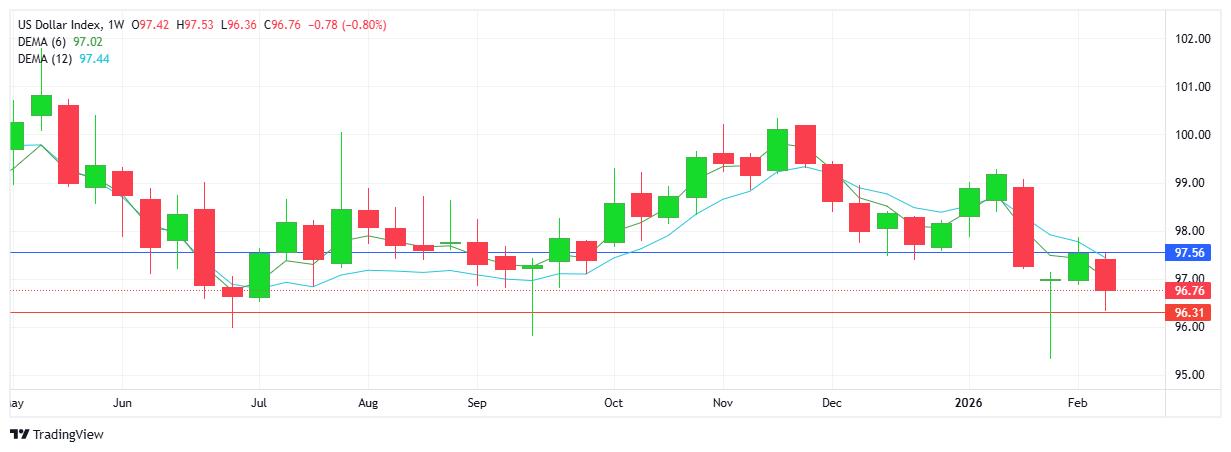
USD INDEX
Following a sharp sell-off on Monday, the balance of the week saw limited activity within a narrow trading range as neither buyers nor sellers added to brief intraday moves. The downtrend remains intact as sellers hover close to the 96.00 support area. Buyers have protected this this level 3 times since June 2025. Resistance at 97.56 with support at 96.31.
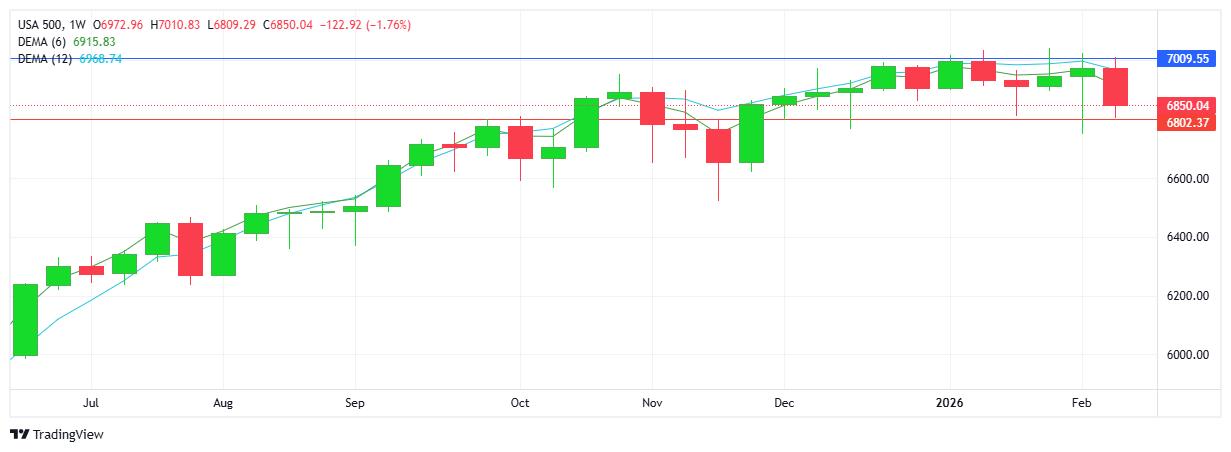
S&P 500
Price activity continues to range between 6800 and 7000 since the start of 2026. The fact that buyers have been unable to maintain above the 7000 level with sellers controlling the majority of the trading, (aside from isolated bounces) feels to be weighing on buyers, therefore tilting the bias to the downside. Resistance at 7009 with support at 6802.
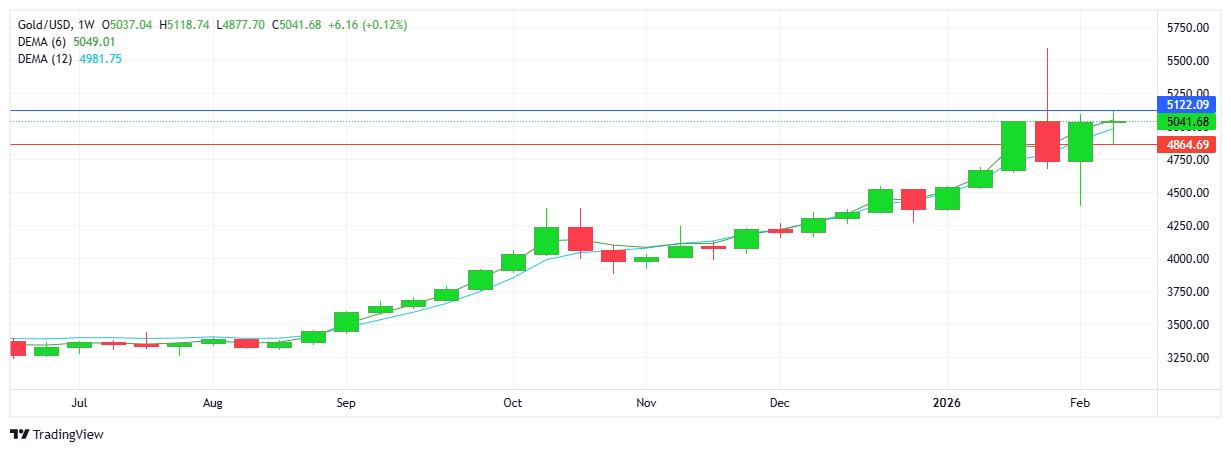
GOLD
A doji-like candlestick with a bullish bias added to the existing uptrend. Notwithstanding the reversal at the end of January/early February 2026, buyers continue to confirm demand for the safe-haven commodity. Although the sell-off was the most extreme for well over a year, once again buyers showed that the lower prices were seen as a new buying opportunity. Next upside target remains $5100. Based on past behaviour patterns, a period of sideways activity and a round of range trading on shorter time frames would not be unusual. Resistance at $5122 with support at $4864.
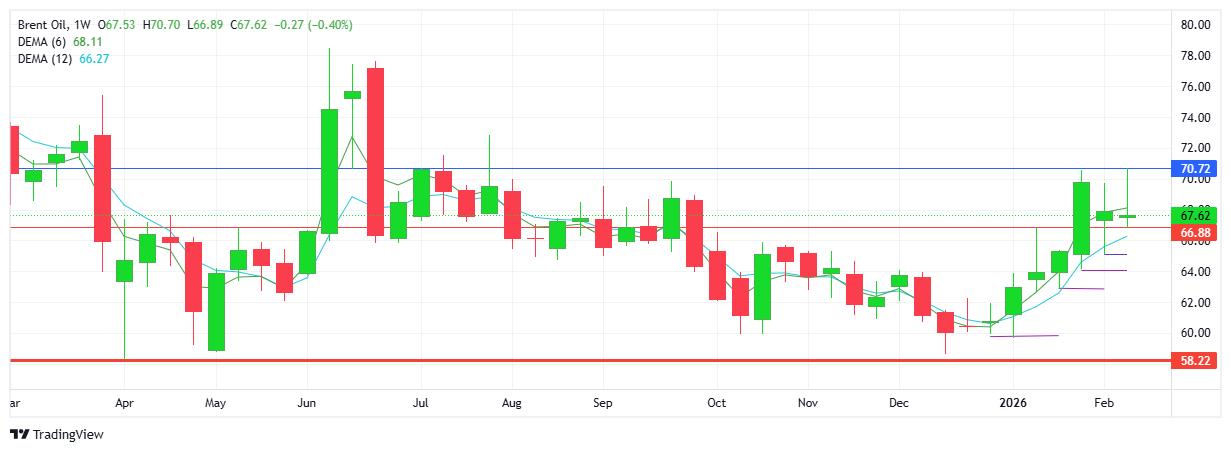
BRENT OIL
One day of selling based on the White House stating “a deal must be reached with Iran”, was enough for a shaky market to erase the recent gains and signal a doji-like candlestick alongside last week’s close. Technically the trend is up and fundamentals feel nervous as the rhetoric between US and Iran maintains a belligerent, rather than a conciliatory tone. Buyers have tested above the $70 level twice in the past 2 weeks. Note the series of higher lows in place since the start of the year. Resistance at $70.22 with support at $66.88.
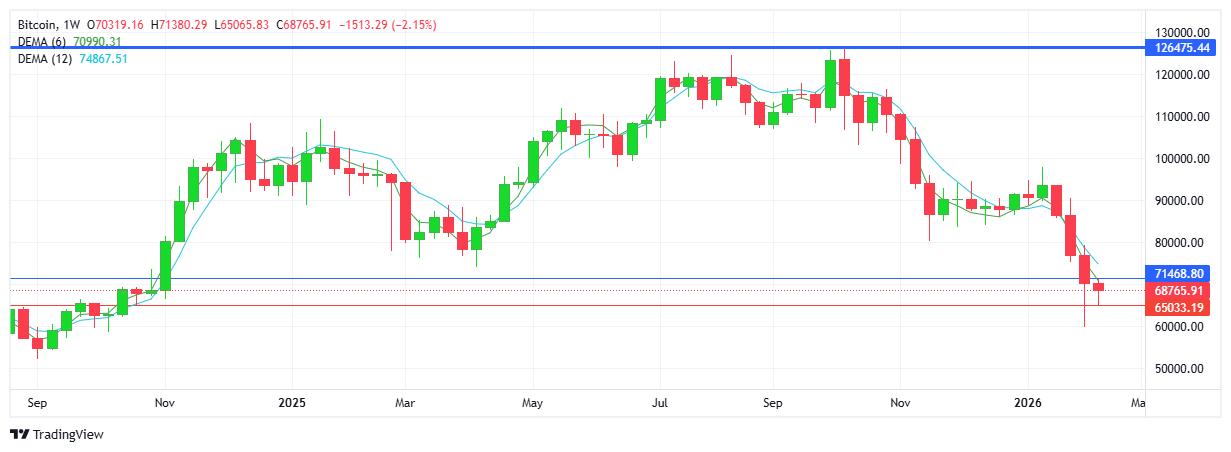
BITCOIN
A 4th consecutive red weekly candlestick confirming the downtrend with sellers maintaining control. Lack of demand has seen attempted bounces unable to gain momentum with the $70K resistance area proving to be a difficult level to break, for now. With technical and sentiment pointing downwards, buyers are looking at fundamentals, perhaps a form of endorsement from a regulatory perspective to incentivize the buy side. Resistance at $71.4K with support at $65K.