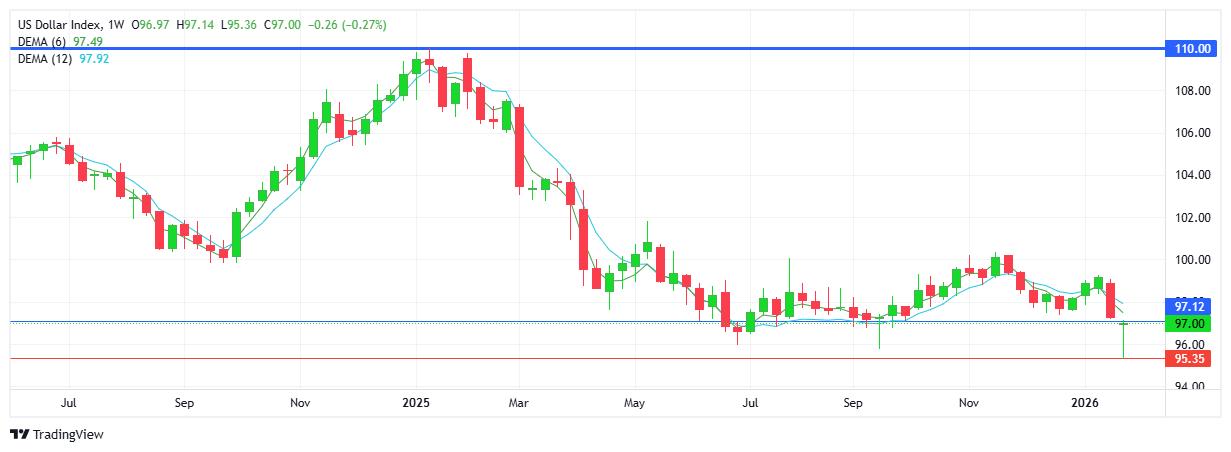
USD INDEX
USD was resilient following a steep sell-off early in the week and then going onto recoup the losses and close the week back at the start/open. Technically the downtrend remains in place with a lower high and lower low on the chart. The week’s low matched levels not seen since early 2022. Buyers will aim to climb above the 97.00 mark as a first step in order to reverse the trend. Resistance at 97.12 with support at 95.35.
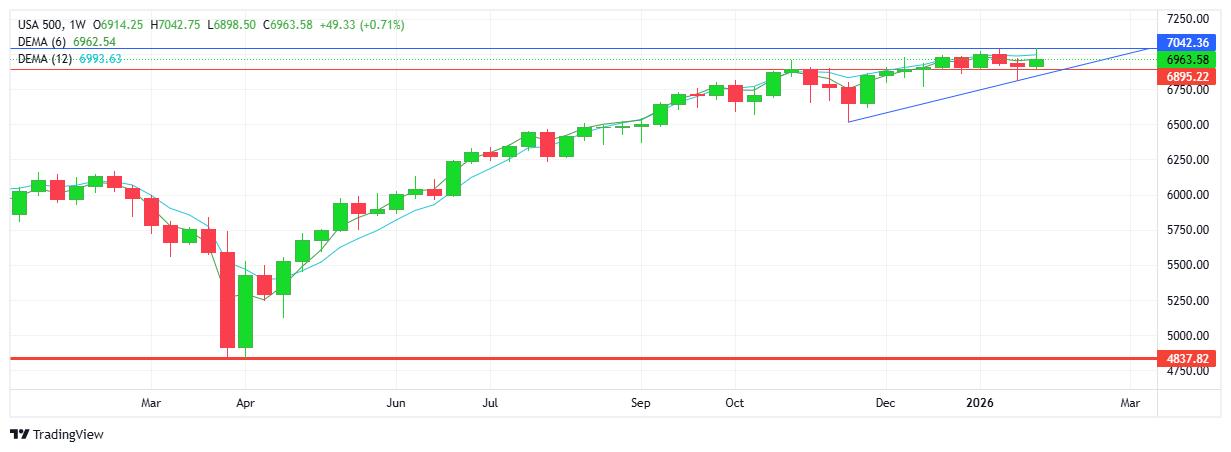
S&P 500
The index started the week with a new record high, and then sold-off over Thursday and Friday to close at 6963, within the now familiar range between 6900 and 7000. Buyers continue to struggle maintaining above the 7000 mark. Note the ascending trendline, coinciding with the 6900 area which sellers look to break. Resistance at 7042 with support at 6895.
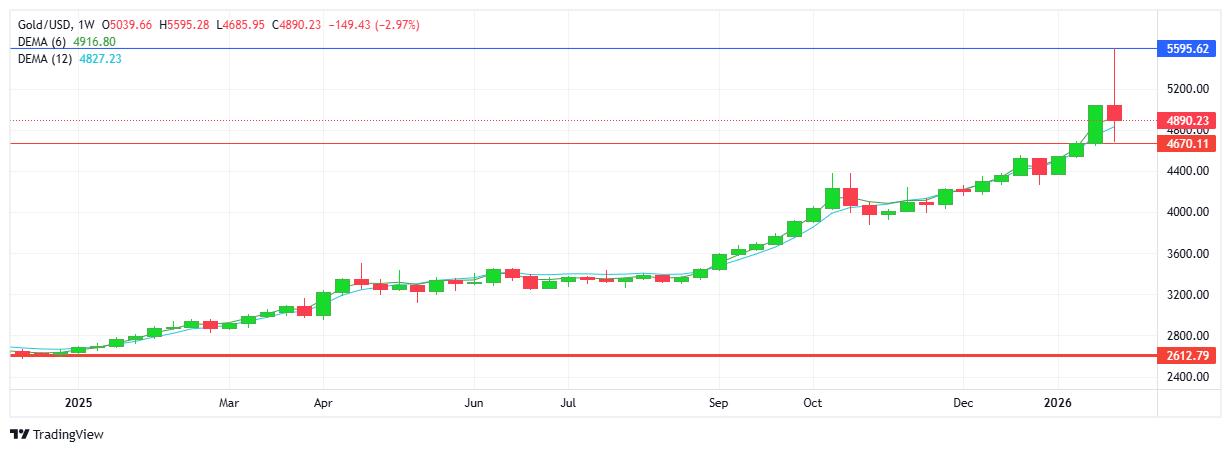
GOLD
What started out Thursday as another record setting high, turned around quickly as sellers stepped in and a bout of profit selling followed. In what has become a familiar pattern buyers stepped in and recouped most of the losses. Yet, it now seems that Thursday was the precursor for what was to follow Friday. Sellers resumed the sell-off, this time with no bounce. The price dropped $760, before settling at $4890. At one point an intraday 12% decline. Biggest one day move in over 40 years. The coming week will see whether buyers see the new “low price” as a buying opportunity, or if further profit taking and panic sets in, in which case prices continue to fall. Resistance at $5595 with support at $4670.
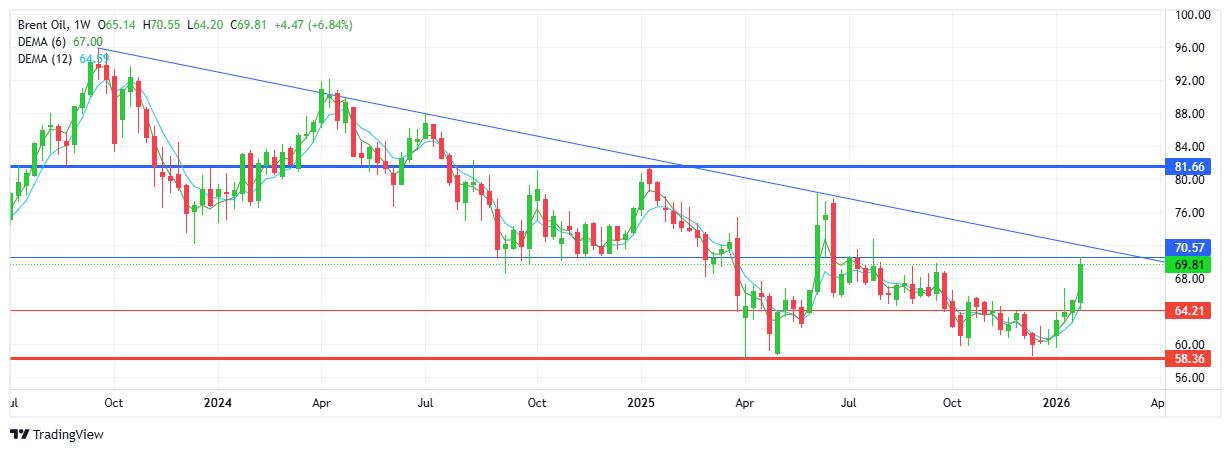
BRENT OIL
Strong demand saw buyers control the week’s activities as a 5th consecutive green candlestick added to the well-established uptrend. Note the descending trendline which sellers will aim to protect as buyers look to retest the $70 mark. Also see current resistance has held as a support level over recent years (2023 and 2024) which does make the level relevant. Continuing aggressive rhetoric between US and Iran contributing to demand. Resistance at $70.57 with support at $64.21.
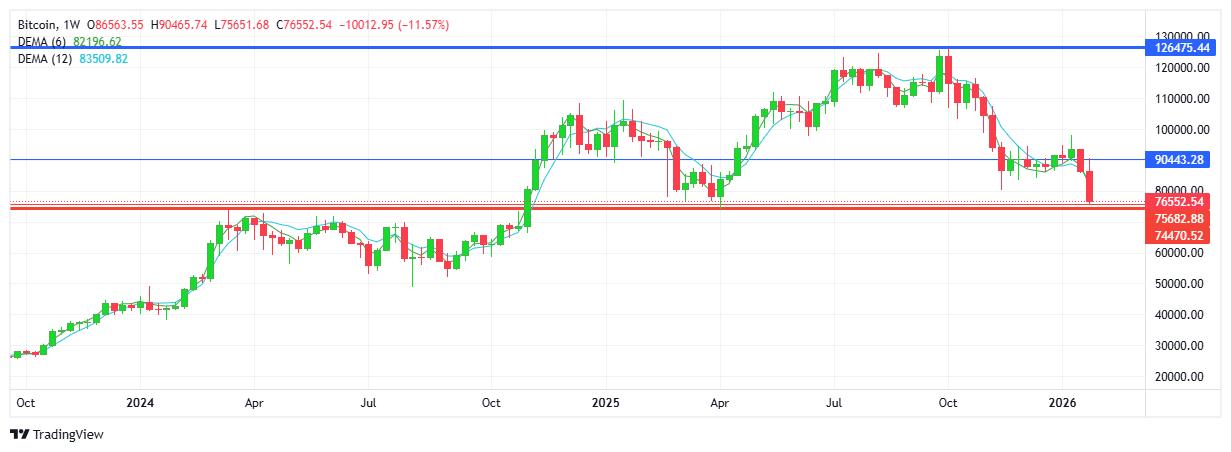
BITCOIN
Sellers added to the previous week’s sell-off with a strong push lower which saw the cryptocurrency lose $15K over the week. Note current support matches the low from March/April 2025, from where buyers went on to rally and set a record high. Same price reached as a previous resistance (March 2024), adding to relevance of the level. Trend, bias and sentiment all point down as BTC now sits $50 K lower than the all-time high from October 2025. Resistance at $90.4K with support at $75.5K.