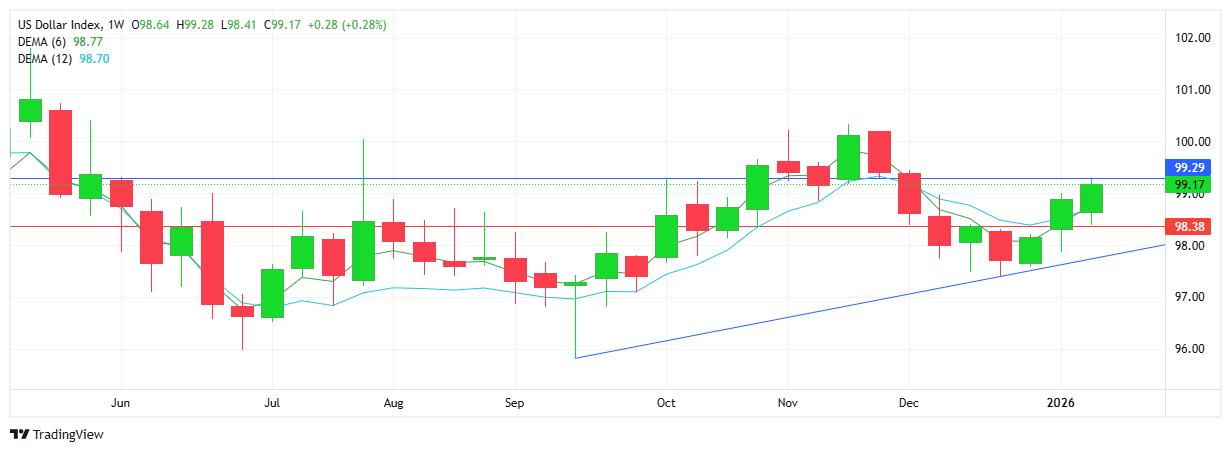
USD INDEX
The USD continued it’s strong start to the year with a 3rd consecutive week of higher highs and higher lows confirming a reversal and new uptrend on the chart. Adding to the technical picture, recent fundamental data has done little to attract the attention of sellers. Based on current demand for the dollar, it appears the markets may well have priced in a decision to hold rates at the upcoming FOMC meeting later this month. Note the ascending trendline in place. Resistance at 99.29 with support at 98.38.
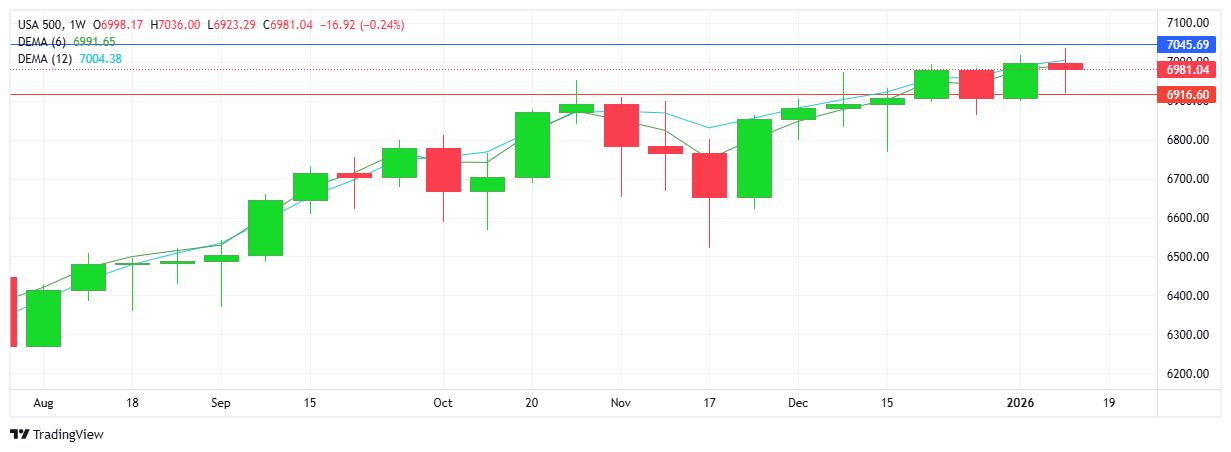
S&P 500
Notwithstanding a new record high for the index this past week, the charts show the uptrend is trading within a comfortable sideways range between 6900 and 7000 for the past month. Buyers maintain control more so as sellers remain on the sidelines, rather than buyers adding to the clear demand we saw throughout last year. Resistance at 7045 with support at 6916.
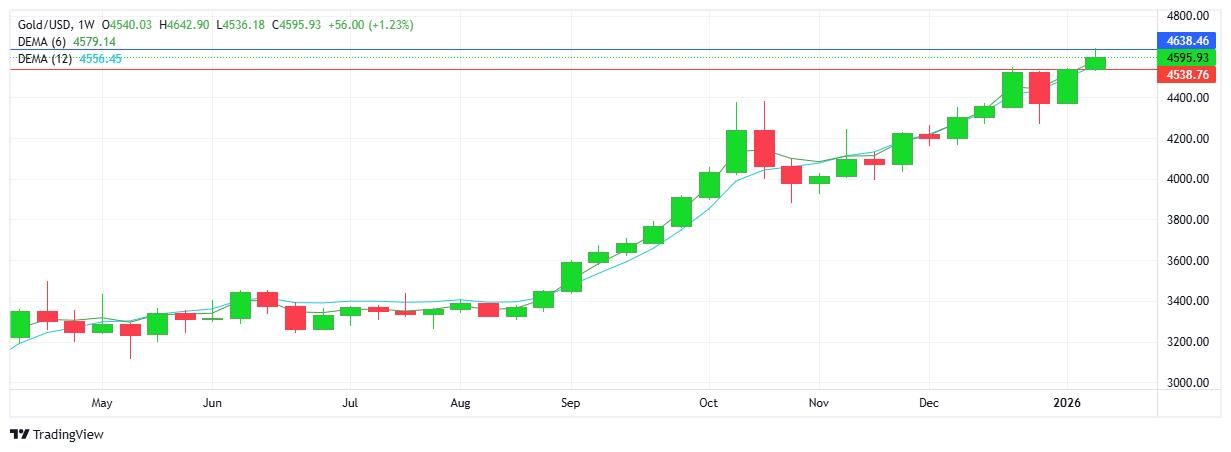
GOLD
A new record high for the metal as buyers confirmed demand for the safe-haven commodity. Currently the technicals, fundamentals and sentiment have given sellers little reason to step in. The 2 factors which should enter the picture at some point, are overbought technicals and a natural pull back as profit taking remains an appealing strategy as signs of a natural retracement appear on the shorter time frames. The $4600 mark did look like a comfort area over the past week. Resistance at $4638 with support at $4538.
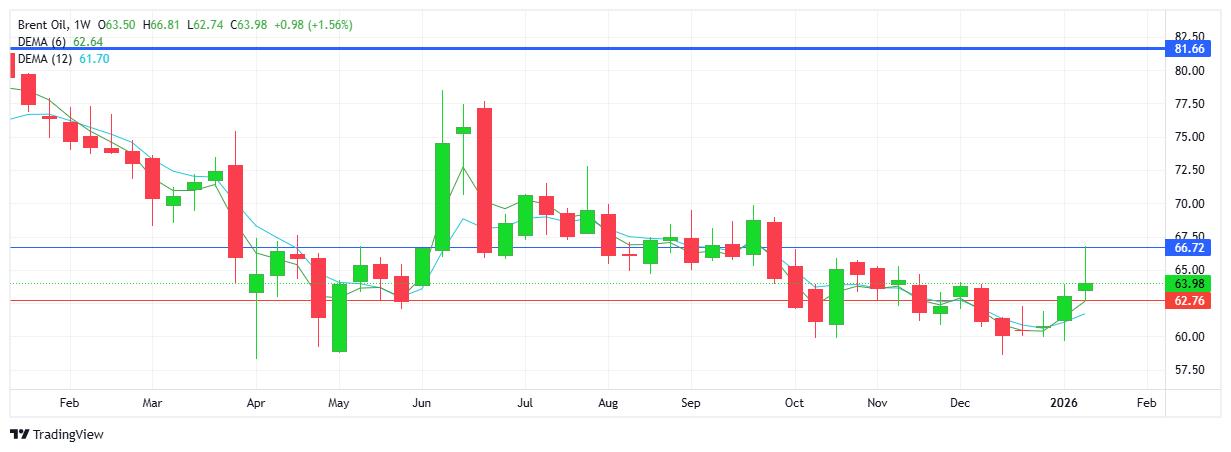
BRENT OIL
The uptrend remains intact with the market remaining fragile as the geopolitical conflict continues in the middle east with the Iran situation front and centre for now. Prices soared as Trump threatened military intervention, only to reverse back lower as he softened his tone later in the week. Perhaps the market will remain relatively stable in response to further rhetoric as opposed to physical action. None the less, swings to the upside could be sharp and erratic. Resistance at $66.72 with support at $62.76.
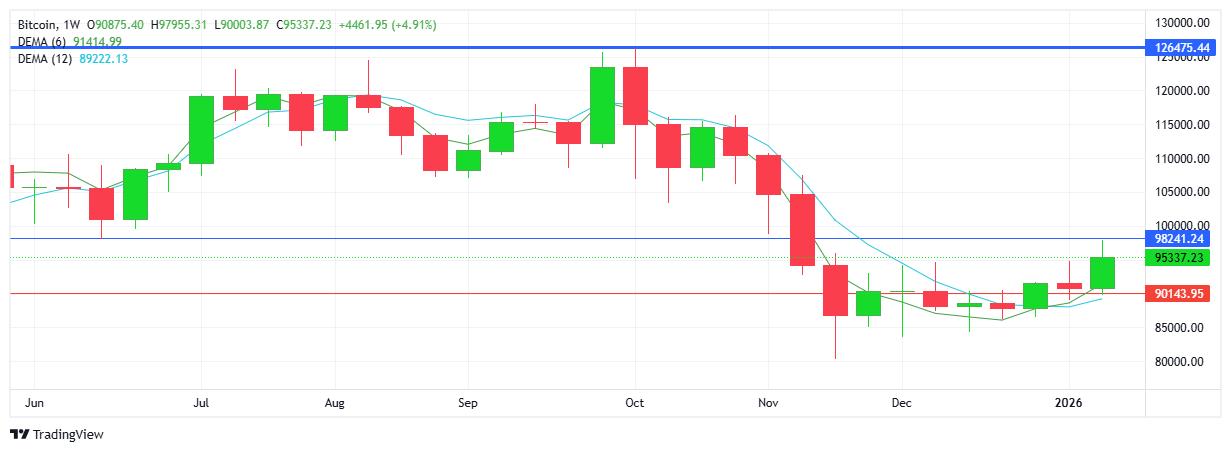
BITCOIN
A strong week for the cryptocurrency as it broke out of the $90K area gaining $7K and edging closer to the $100K mark. The chart signals a 4th consecutive higher high and higher low on the chart as buyers put in the first noticeable effort in rebounding from the $40K+ sell-off from late last year. Resistance at $98.2K with support at $90.1K.