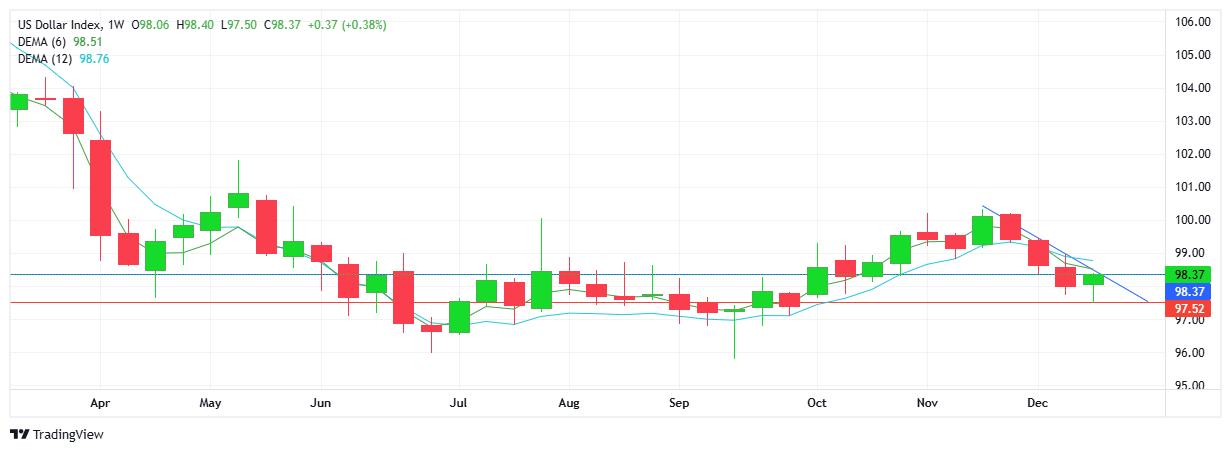
USD INDEX
Buyers were successful in putting an end to the 3 week sell-off and did enough to put in a higher close, confirming a green candlestick on the chart. However, the downtrend remains intact (EMAs pointing down). Note current resistance is aligned with the descending trendline, the level which buyers need to break above in order to reverse the trend. Resistance at 98.37 with support at 97.52.
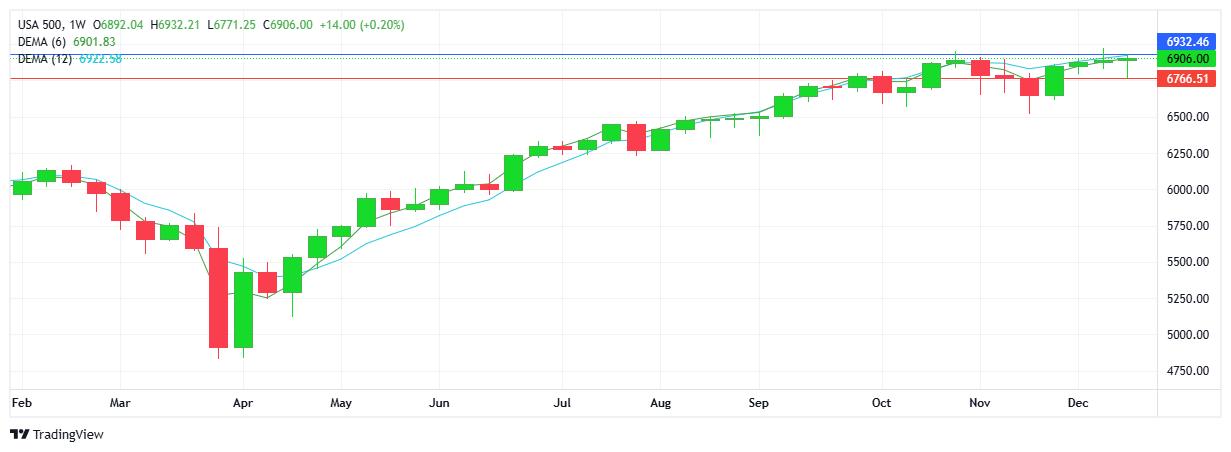
S&P 500
Another strong week for US stock markets with the index maintaining close to the 6900 resistance area for the 3rd consecutive week. Buyers will look up to the 7000 mark and add to the santa rally, while sellers recognize the rally has slowed down, and could be influenced by profit taking strategies going into the year end. Resistance at 6932 with support at 6766.
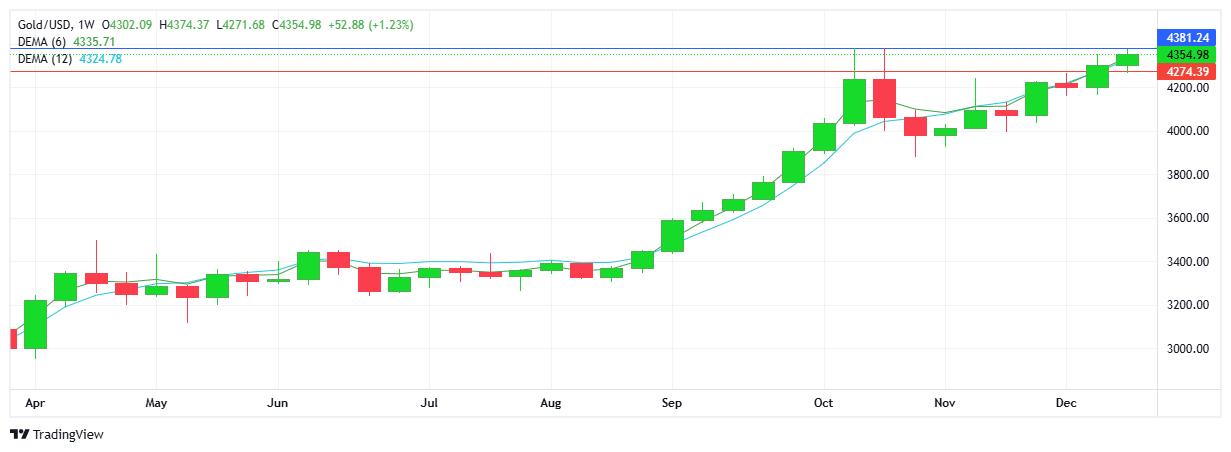
GOLD
Demand for the safe haven commodity continued through the shortened Christmas trading week with a 4th consecutive higher high and higher low on the chart. Current record high levels were tested in October, where sellers did step in for a $400+ 2 week sell-off. Buyers will look up at $4400 aiming for yet another new high before year-end, while sellers look below $400 on the downside. Resistance at $4381 with support at $4274.
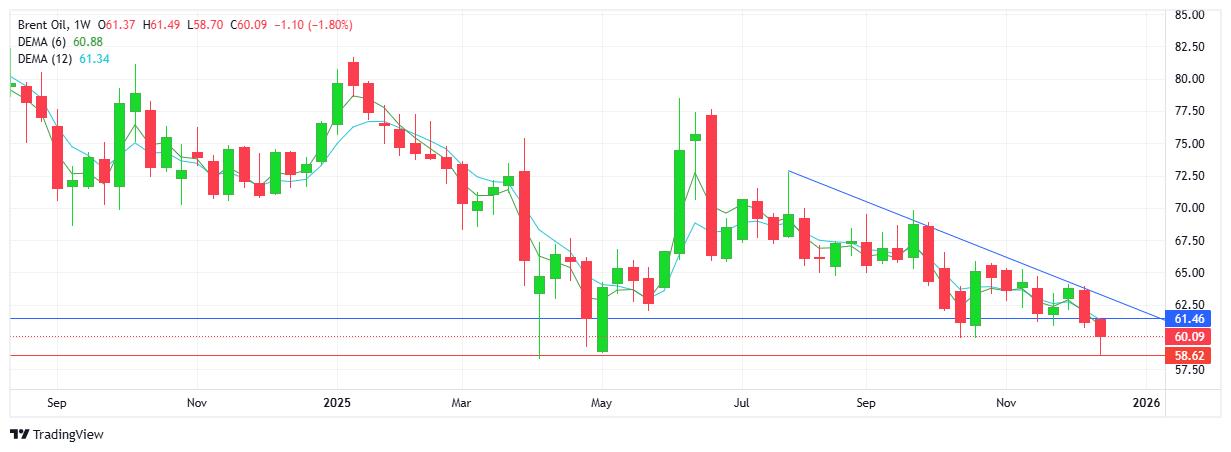
BRENT OIL
A brief attempted bounce to start the week was cancelled out on Friday when sellers wiped out earlier gains and added to the established downtrend on the weekly chart. Current price hovers close to the pivotal and significant $60 level going into the last days of the year. Fundamental factors could influence direction with Ukraine/Russia/US peace plans currently underway. Note current support matches the lows from earlier this year (April and May 2025). Resistance at $61.46 with support at $58.62.
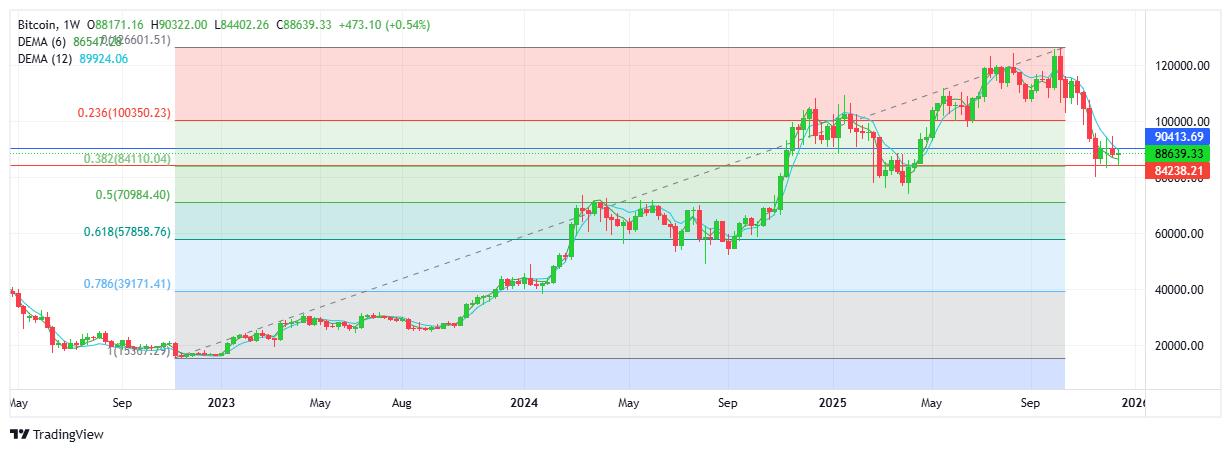
BITCOIN
Neither buyers or sellers were able to hold on as the sideways activity continues into the year end with another weekly close sitting at the $88K comfort area. Note this is the 5th consecutive week that weekly closes have been contained within a narrow $4K range between $86K and $90K. Interesting perspective: the fib retracement tool measured from Nov 2022 ($16K) up to the October 2025 high ($126K) shows the first fib retracement level (38.2%) at $84K. Resistance at $90.4 with support at $84.2K.