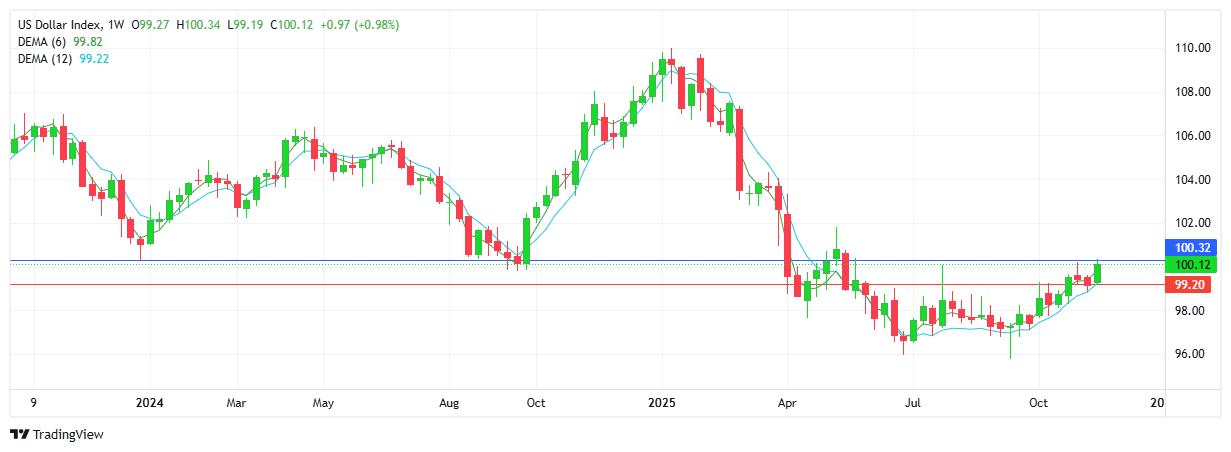
USD INDEX
A strong week for the USD against all the majors, clarified with the index adding to the uptrend and recouping losses from the previous two weeks. The Fed contributed by casting doubt on next month’s rate cut, adding demand the global currency. The sell-off across the major US stock markets was also helpful to the USD, confirming the inverse relationship between the 2 major asset classes. Note resistance matches the support from December 25, 2023. Resistance at 100.32 with support at 99.20.
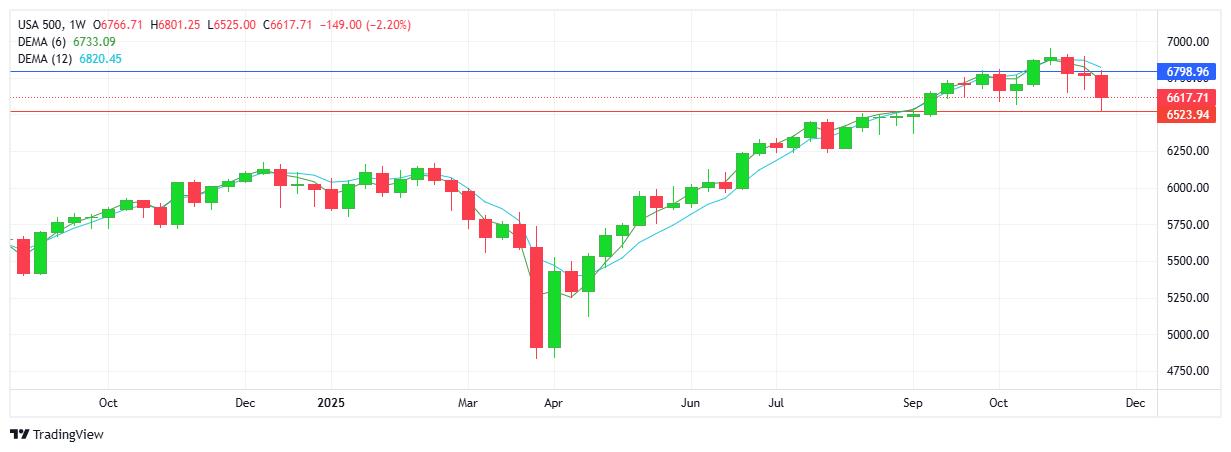
S&P 500
Notwithstanding Friday’s bounce, sellers controlled activity with a 3rd weekly red candlestick and A significant lower low on the chart adding to the downtrend. Although there was no distinct reason for the push lower, the mood/sentiment seemed to take a bearish turn with sellers ensuring the lowest close since October 6, 2025. Resistance at 6798 with support at 6523.
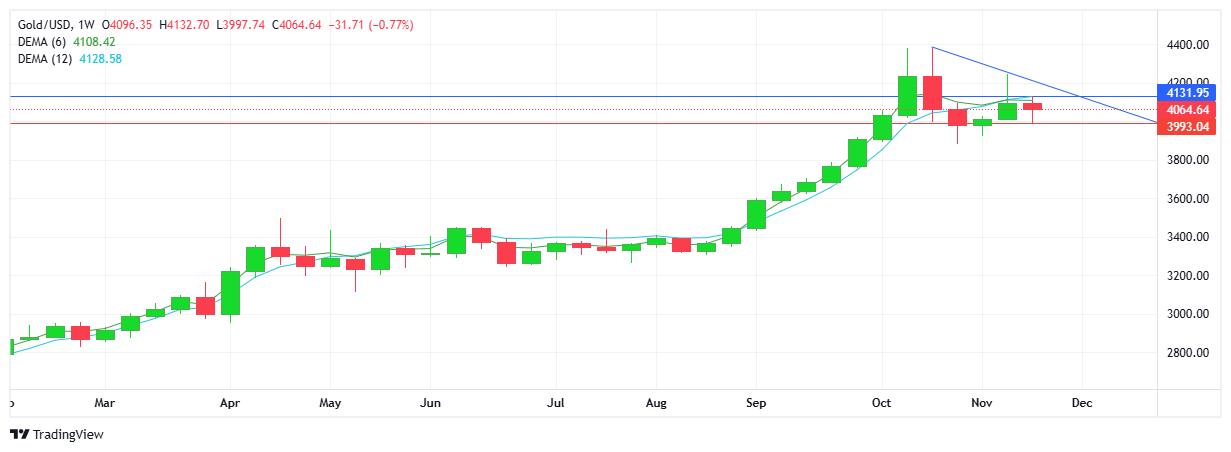
GOLD
After a standout year for the metal with buyers in total control and stepping in at any signs of weakness, it appears that gold has taken a well-earned breather going into the last 5 weeks of the year. Clearly the commodity has not lost its safe-haven status and therefore the pull back off the record highs from last month seem more of a natural retracement than a full reversal. Sellers will look at the double top candlestick formation (reversal sign) which is still in play, as well as the initial stages of a potential descending triangle formation (bearish). The $4050 has been a comfort level over the week, while buyers have continued to guard the pivotal $4000 mark. Resistance at $4131 with support at $399.
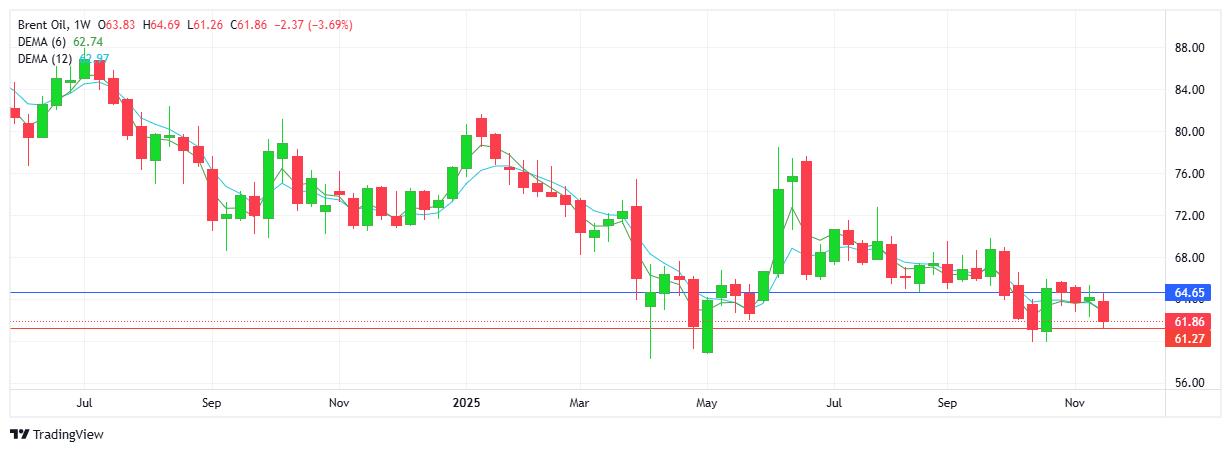
BRENT OIL
Sellers won out over the week and added to the downtrend with all technicals confirming the bearish mood on the charts. Note the 4th consecutive lower high and lower low on the charts. However, a bird’s eye view does still show the loosely bound sideways range between $62 and $64 is remains in play. Without fundamental news which would be expected to affect supply and demand issues for the commodity, there may be further range trading going into the new week. In this regard, Trump’s peace proposal for the Russia/Ukraine conflict could contribute here. Resistance at $64.65 with support at $61.27.
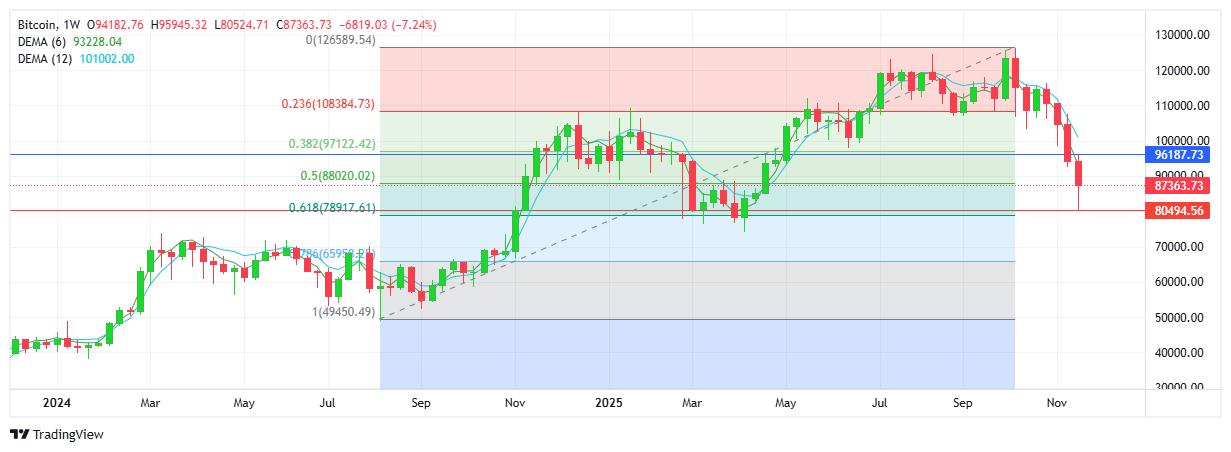
BITCOIN
Sellers continue to add to the strong downtrend with a 4th consecutive red candlestick, 6 out of 7 down/red weeks, with lower highs and lower lows leaving no doubt as to the strength of the trend. Bitcoin has come down from the $126K all-time high in October, to $80.4K in a matter of just 7 weeks - a drop of over $45K! In what manner the cryptocurrency will recover remains to be seen, yet for now it would seem that relevant technical levels will provide the most reliable source of information from a trading perspective. Note current support levels were tested earlier this year (Feb and March 2025), from where buyers went on to set record highs. The fib retracement tool which measures the rally from August 2025 to October 2025 shows the 50% retracement level at $88K. Following Friday’s bounce the current price going into the new week sits at this level. Resistance at $96.1 K with support at $80.4K