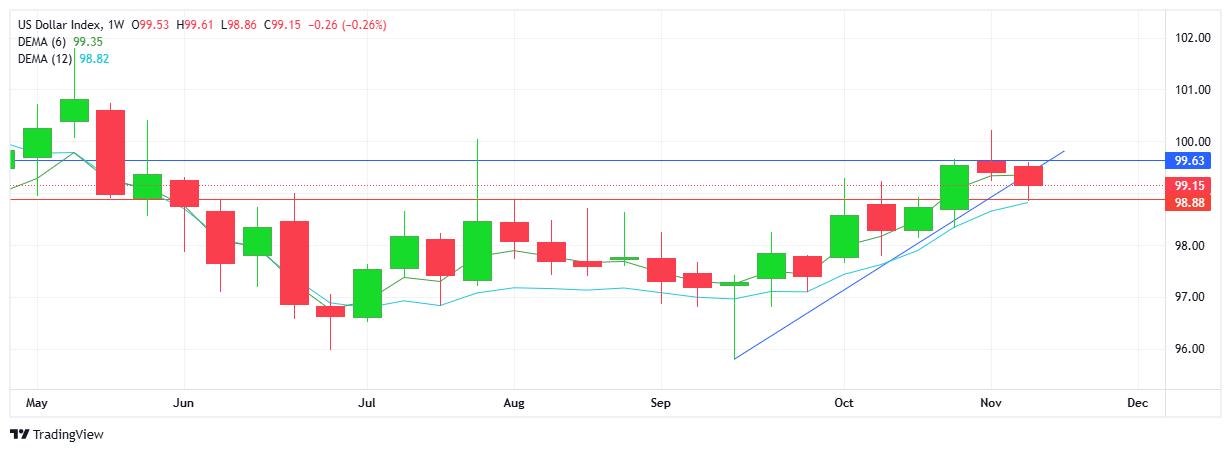
USD INDEX
Although the uptrend remains in place (EMAs up), sellers won out for the 2nd consecutive week with a lower high and lower low on the charts. While the trend remains up, sentiment surrounding the global reserve currency appears uncertain with supply outweighing demand at this point. A further technical adding to the downside is the break below the ascending trendline from September 15 2025. The dollar weakened against the majors over the week, with the USD/JPY the sole outlier. Resistance at 99.63 with support at 98.88
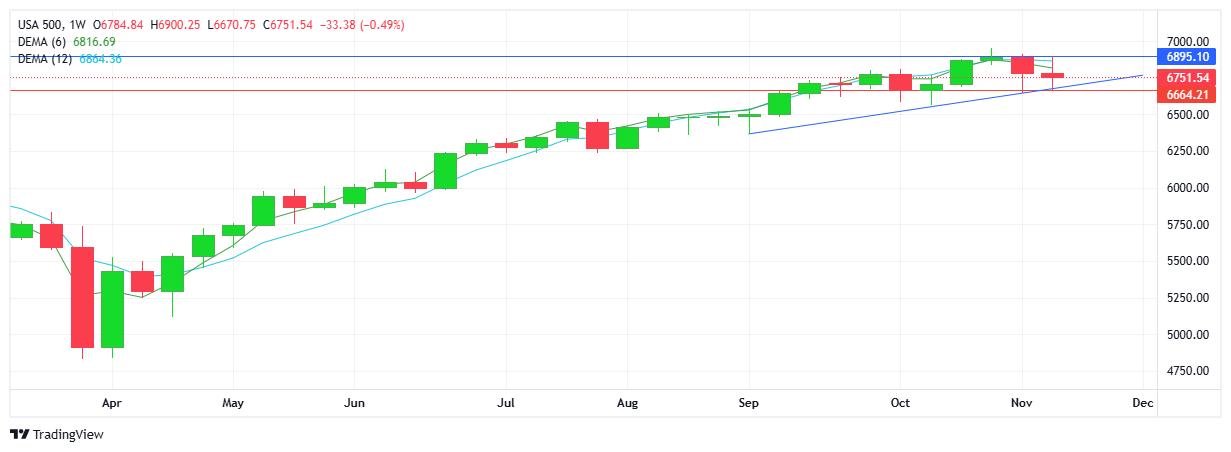
S&P 500
Sellers edged out a win for the 2nd consecutive week. Downtrend confirmed on the chart with EMAs crossed down. However, note the strong bounce up as buyers continue to guard the 6700 support area. Further, note the ascending trendline which remains intact. And interesting that the index weakened together with the USD, as opposed to the traditional inverse relationship between the two. Resistance at 6895 with support at 6664.
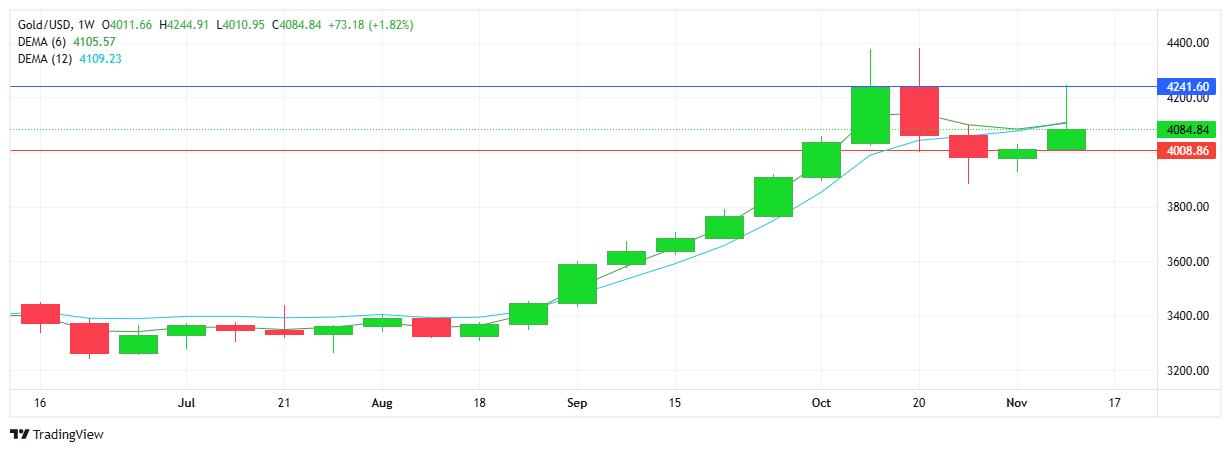
GOLD
The metal rallied to start the week, only for sellers to step in and close the week with a strong sell-off. The 2-day reversal was enough to signal a new downtrend on the daily chart. Gold has not fully recovered from the sharp reversal (October 21), and the double top candlestick pattern (reversal sign) still holding out. The overall price activity has a retracement, rather than reversal feel, as the commodity retains its safe haven status within the financial marketplace. The $4000 mark continues to be a pivotal level, protected by buyers. Resistance at $4241 with support at $4008.
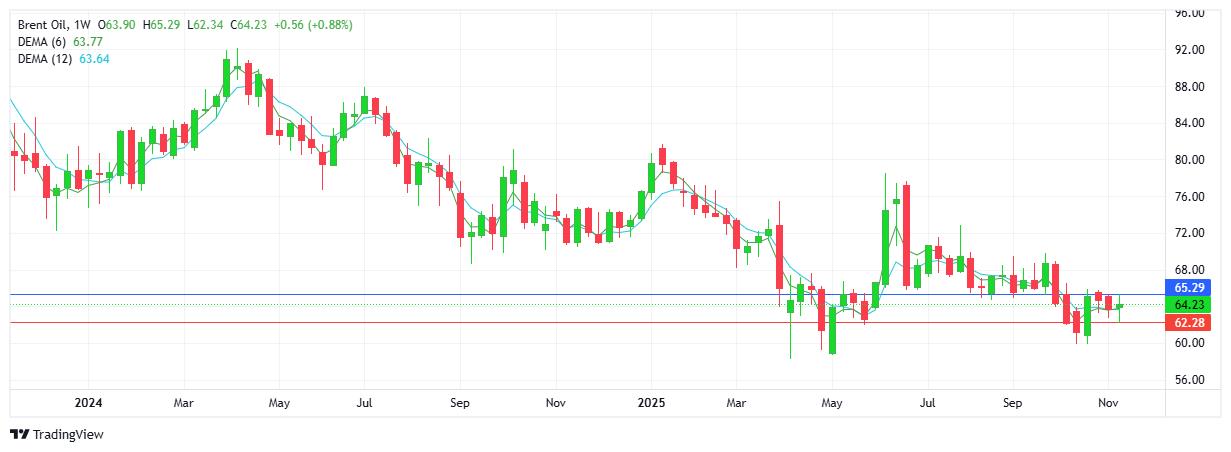
BRENT OIL
Oil continues to trade in a relatively narrow range between $63 and $64. The EMAs lie sideways/flat with neither side able to add to daily moves. Technically the chart currently reflects lower highs and lower lows and over the past year the bias continues to point down with a series of lower highs going back to 2024. However, with global geopolitical conflicts continuing to remain unresolved, fundamental factors can quickly change should supply issues enter the picture. Resistance at $65.29 with support at $62.28.
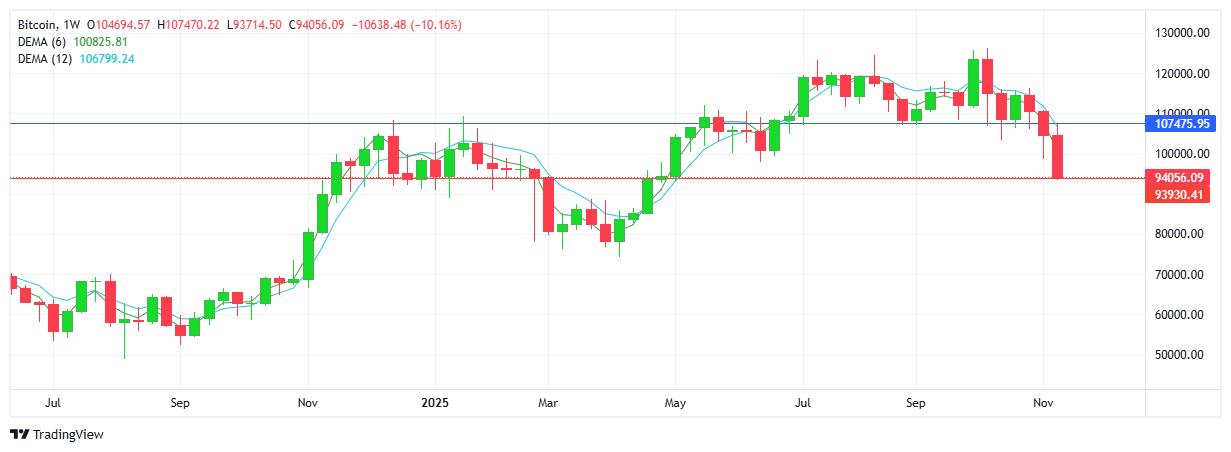
BITCOIN
A strong and significant sell-off saw the cryptocurrency move almost $10K lower and in so doing took out relevant support levels on the way. Trend, sentiment and bias are all clearly bearish with buyers remaining on the sidelines, for now. Fib retracement levels were broken to the downside, as was the psychological $100K mark. Note that while the weekly charts confirm the strength of the trend, daily charts are signalling oversold conditions (RSI 30). Sellers will continue to aim below $94K while buyers look above $97K as a minimum bounce to get back to the $100K area. Resistance at $107.4K with support at $93.9K.