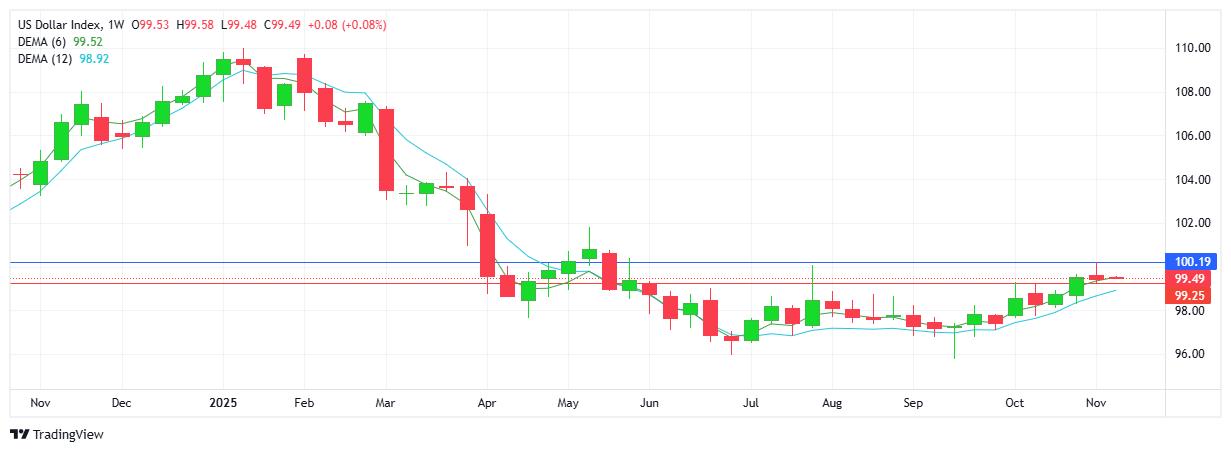
USD INDEX
Buyers started the week on the front foot adding to the previous week’s gains, however it did not last as sellers stepped in, halted the momentum and went on to close the week lower, adding a red candlestick on the daily chart. Notwithstanding, the uptrend remains intact and the candlestick does add a higher high and higher low to the trend. Noteworthy that buyers were not able to hold above the 100.00 mark, again. Resistance at 100.19 with support at 99.25.
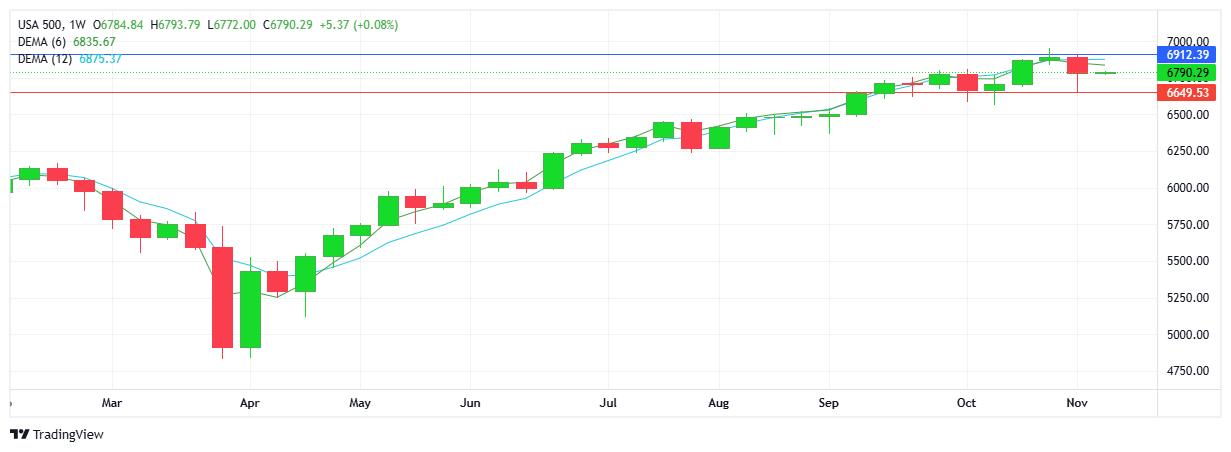
S&P 500
Sellers controlled price action through most of the week, although buyers did put in a strong fight back on Friday. The red weekly candlestick confirms a reversal (downtrend) on the charts. Note the strong support area guarded by buyers as sellers continued to be held up at the current support levels. Resistance at 6912 with support at 6649.
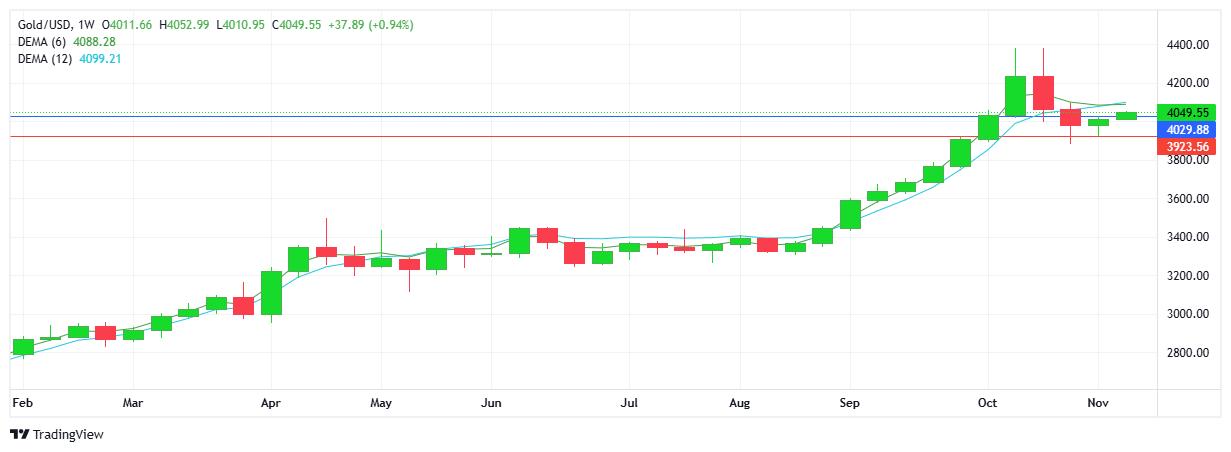
GOLD
Gold showed resilience as sellers were unable to add to the downtrend. The trading range was narrow with neither buyers or sellers adding to intraday moves. Note the double-top candlestick pattern (reversal sign) is still I play. It seems that the profit taking has come to an end, however there has been limited demand as brief rallies have been unable to maintain above the pivotal $4000 level. While the commodity remains the stand-out safe haven asset, perhaps a well-earned breather is a natural follow up to the record-breaking trend since the start of the year. Resistance at $4029 with support at $3923.
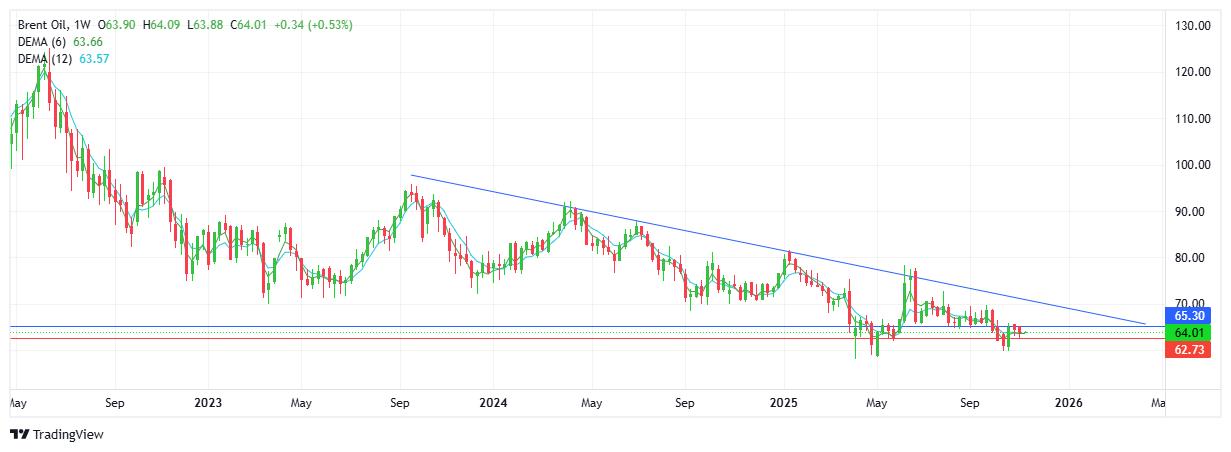
BRENT OIL
Sellers added to last week’s move lower with a lower high and lower low on the charts. The trend and bias both point downward with 6 of the past 7 weeks reflecting a red candlestick. Taking a step back the charts reflect a steady downtrend from September 2023 with a succession of lower highs on the weekly chart. Sellers will look to test the $60 level while buyers will look above $65 to reverse the trend. Fears of a global economic slowdown and long standing geopolitical unrest add to the negative sentiment. Resistance at $65.30 and support at $62.73
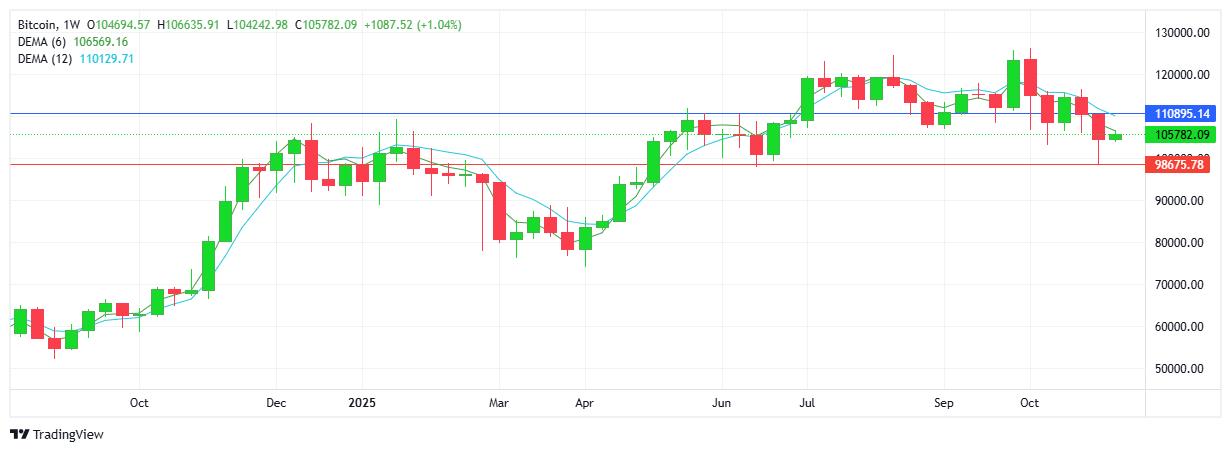
BITCOIN
Sellers added to the well- established downtrend and broke below significant support levels on the chart. After break below the $100K mark, buyers did step in and bounce up off the same level which was tested earlier in the year (June 16 2025). For now, the bias and trend continue to point lower as buyers have been unable to make a meaningful reversal on the daily chart. Buyers will aim to reclaim the $110K while sellers will continue to aim below the $100K mark. Resistance at $110.8K with support at $98.6K.