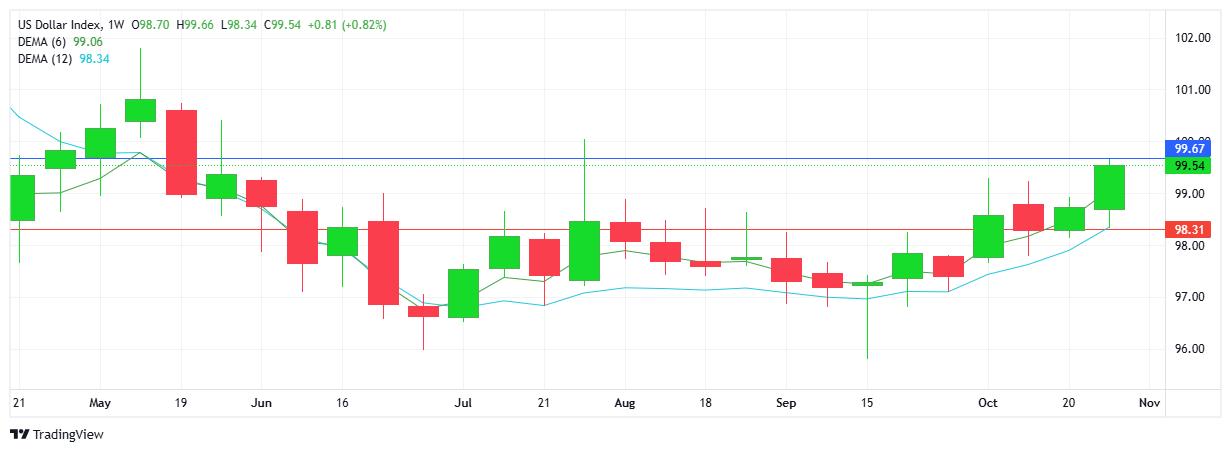
USD INDEX
A strong week for the USD on all fronts in response to the Fed’s rate cut and the chairman’s accompanying statement where he hinted that another cut in December was not a sure thing. The index has rallied since and buyers are firmly in control (EMAs confirm the uptrend) with the chart showing current highs not seen since earlier in the year (July 28 2025). Note that sellers stepped in at that time as buyers were unable to maintain the 100.00 mark. Resistance at 99.67 with support at 98.31.
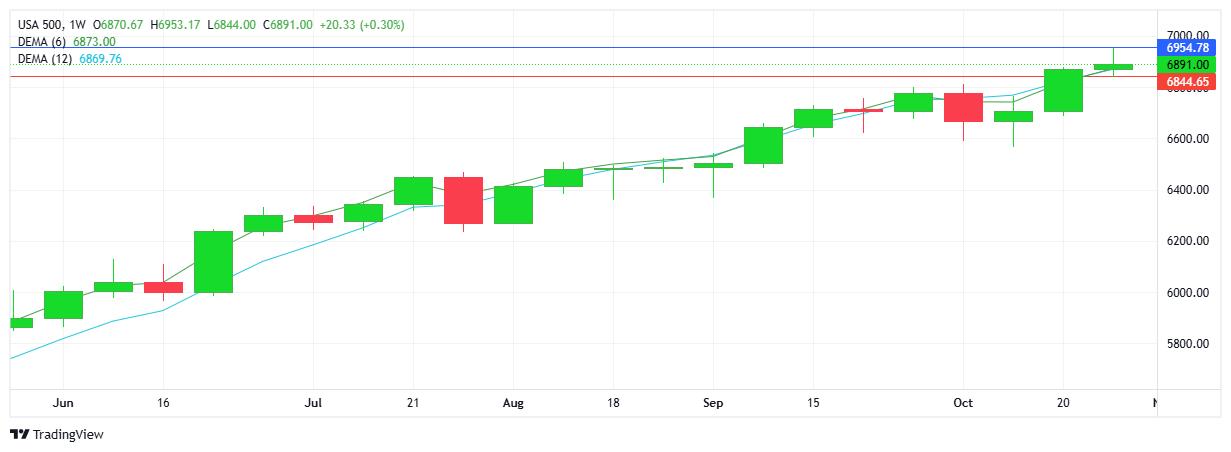
S&P 500
New record highs were set early in the week, however sellers took over following the Fed’s rate cut. Prices closed the week back where they started and a weekly doji-like candlestick confirms the indecision. The uptrend remains intact with a higher high and higher low adding to the upward bias. Resistance at 6954 with support at 6844.
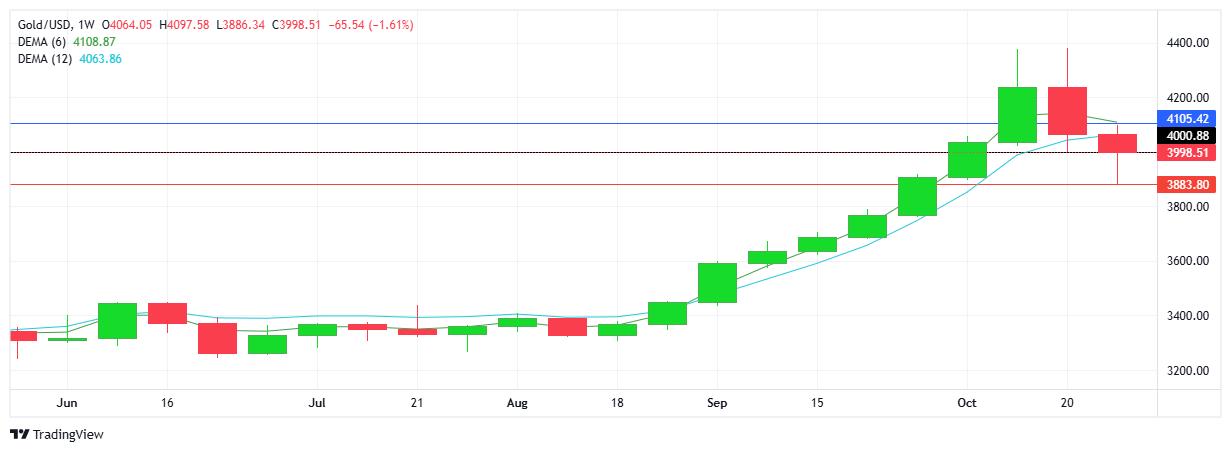
GOLD
The sell-off continued for the 2nd week with sellers maintaining control. Technically the double-top candlestick pattern (reversal sign) has played out with a lower high and lower low on the chart. Although a strong USD and an expected bout of profit taking contributed to the sell-off, gold’s safe haven status has kept sellers from completing a reversal on the weekly chart. The $4000 mark continues to be guarded by buyers and the level is clearly shaping up to be pivotal - note the starting level heading into the new week. Resistance at $4105 with support at $3883.
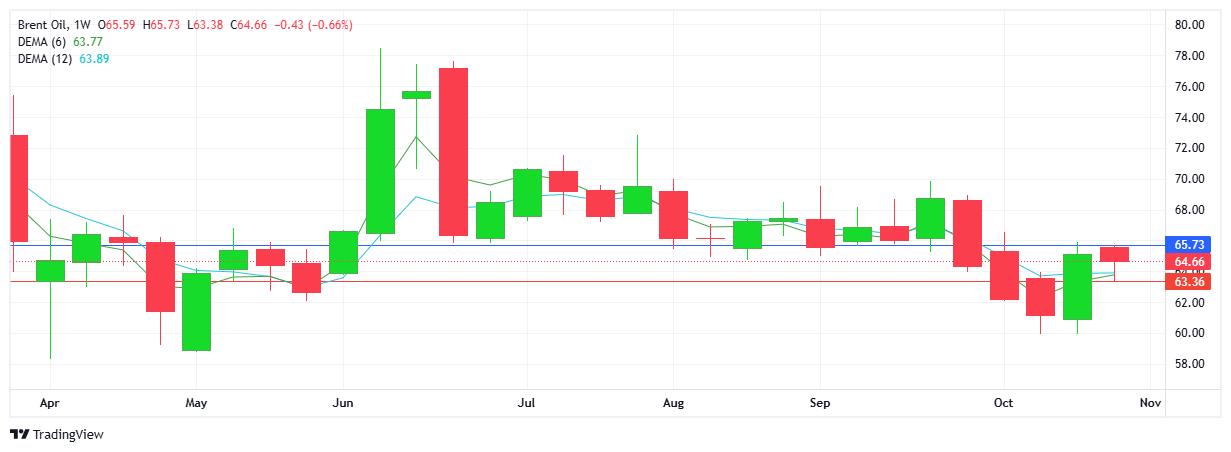
BRENT OIL
Notwithstanding a higher low on the chart, buyers were not able to add to last week’s gains (double bottom candlestick pattern) and not able to maintain above the $65 level. Sellers did win out for the week, although the close basically matches that of last week. Buyers will look up to $66 in an attempt to start an “almost uptrend” while sellers look below $64 in order to re-establish the downtrend. Resistance at $65.73 with support at $63.36.
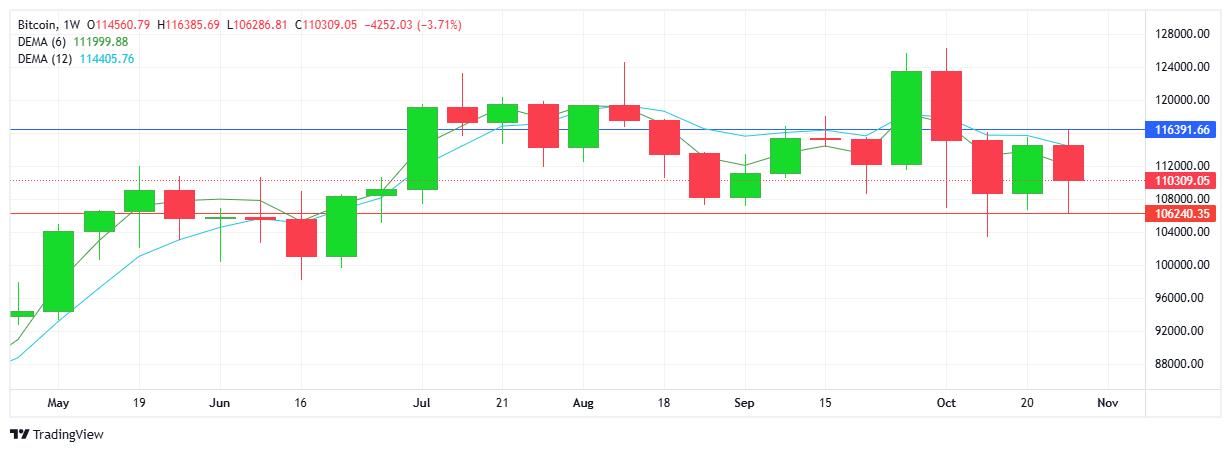
BITCOIN
Sellers erased the majority of last week’s gains and kept the downtrend intact, with EMAs confirming the trend and bias. Note the trend on the daily chart has been moving sideways through the latter part of the week as buyers and sellers hover close to the $110K mark - a level which appears to be a comfort area for now. Resistance at $116.3K with support at $106.2K. The close price over the past 4 weeks has been within this familiar $10K range (and for 10 of the past 11 weeks). While buyers look up to $120K to reestablish a meaningful uptrend and set new record highs, sellers look to test $100K on the downside. Sentiment has a bearish feel.