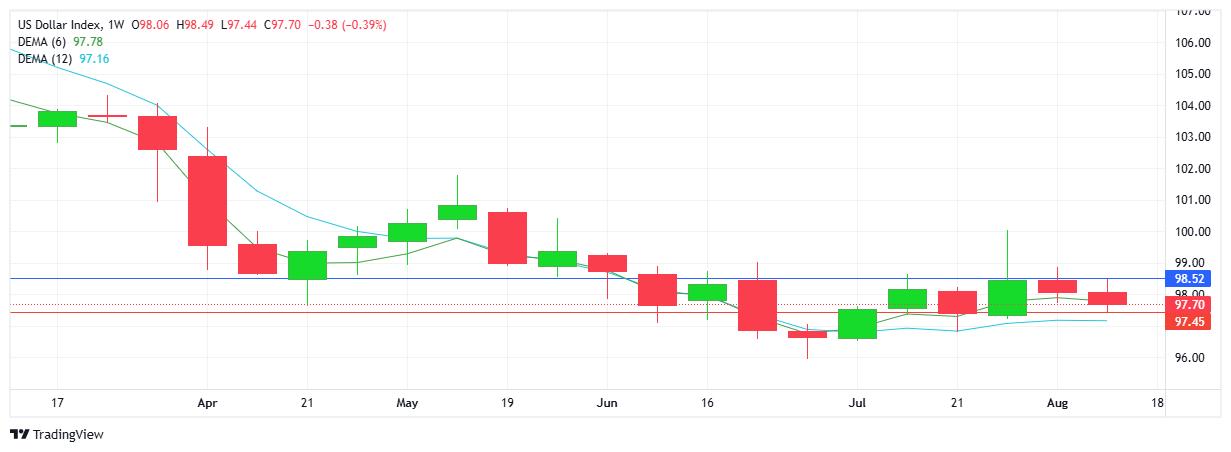
USD INDEX
Weak USD theme continued this week with the index trading within a relatively narrow range between 97.50 and 98.50. The EMAs show the leading indicator above the lagging indicator, although sideways more accurately describes the trend. Further contradiction shows a 2nd consecutive lower high on the charts. Resistance at 98.52 with support at 97.45. While negative sentiment continues to surround the global currency, the question of interest rates is the leading influence regarding USD strength (or weakness) going forward.
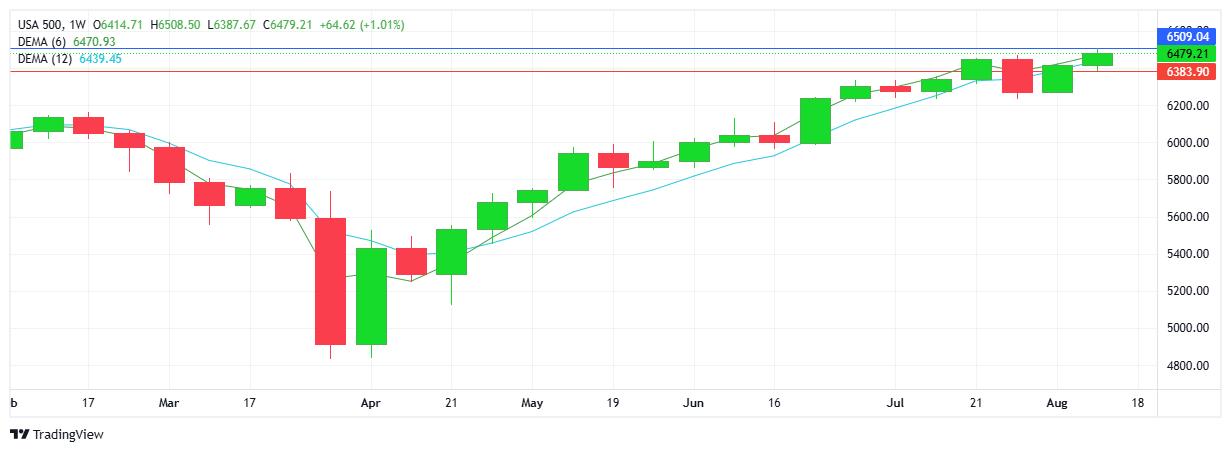
S&P 500
Demand for US equities remained strong this week with the S&P reaching record highs and record closes as buyers maintained control. Sellers have not been able to halt the rally, notwithstanding overbought technical readings or bouts of profit taking. With no new tariff announcements, the market appears to be out of the uncertainty phase and into the - no news is good news period. Resistance at 6509 with support at 6383.
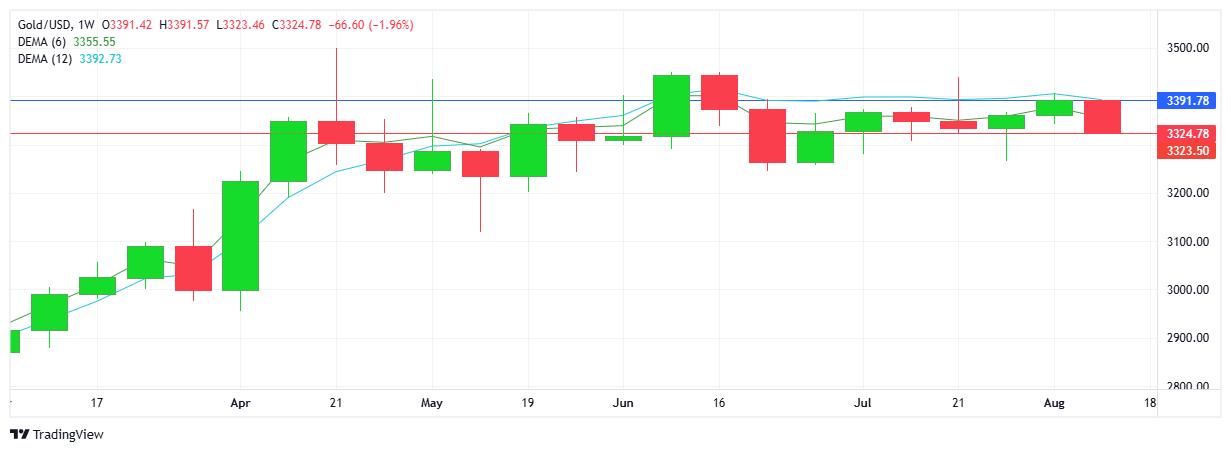
GOLD
The metal was sold steadily through the week with buyers content to watch from the sidelines. Resistance at $3391 with support at $3323. Noteworthy that gold moved lower in tandem with the USD, as opposed to the traditional inverse relationship: weak USD=strong gold. Note the support area which has held strong for the past 7 weeks. With geopolitical conflicts continuing to appear unsettled - Ukraine and Middle East - neither has provided an incentive for buying the safe haven commodity.
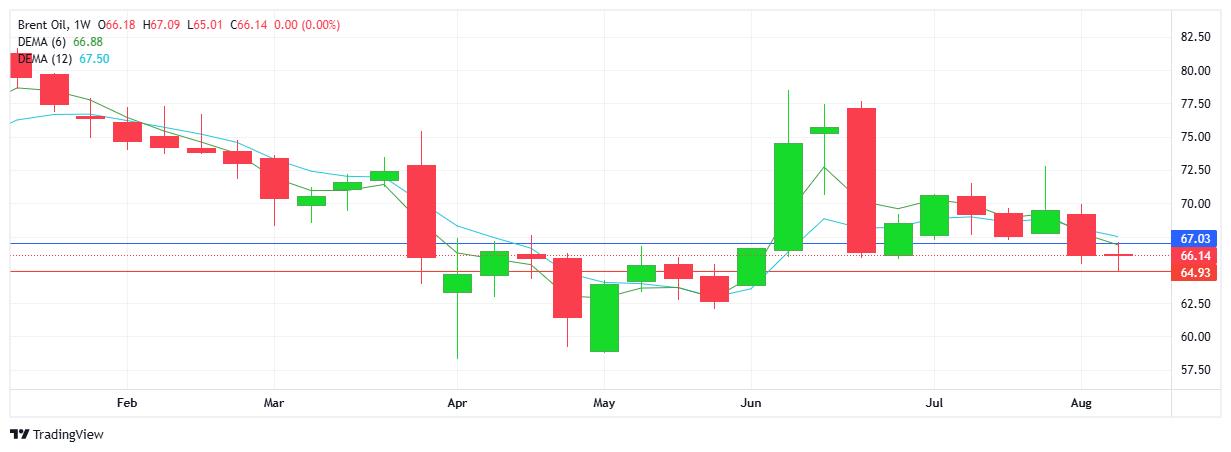
BRENT OIL
The downtrend remains intact with lower highs and lower lows on the chart. Note that buyers did step in to halt the slide and went on to close the week back where it started, with a doji candlestick confirming the indecision. Perhaps the current level is a comfort zone as buyers and sellers swap punches with buyers unable to break above $67 and sellers unable to maintain below $65. Resistance at $67.03 with support established at $64.93.
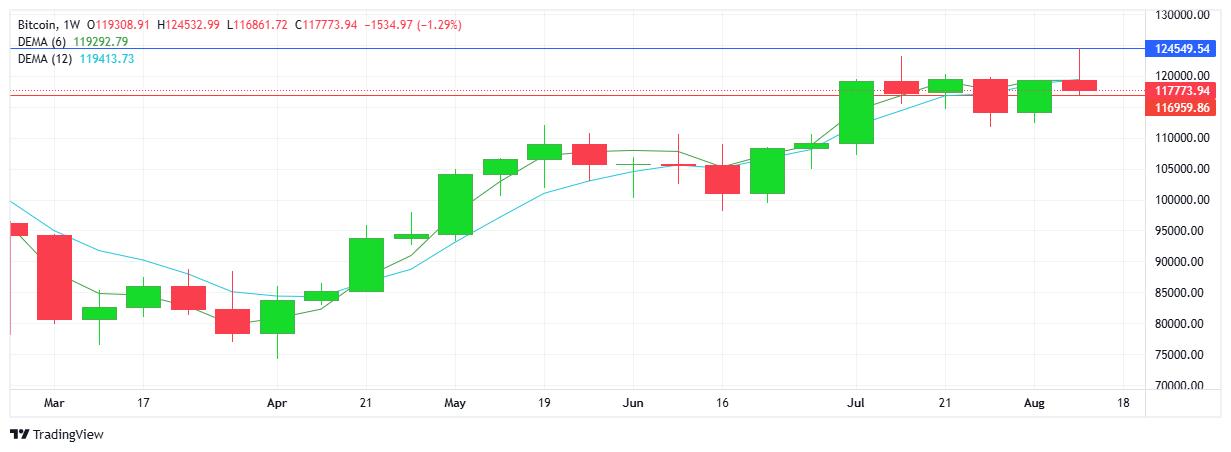
BITCOIN
A mixed week for the cryptocurrency as buyers set a new record high, only to see sellers step in, erase all gains and close the week lower than the open. While technically the EMAs point downwards, the chart reflects a higher low and higher high. The weekly candlestick formation favours the bias tilted to the downside. Resistance at $124.5K with support at $116.9K. Sellers looking to add to the downward reversal will aim for the $110K mark, while buyers look above the $120K level.