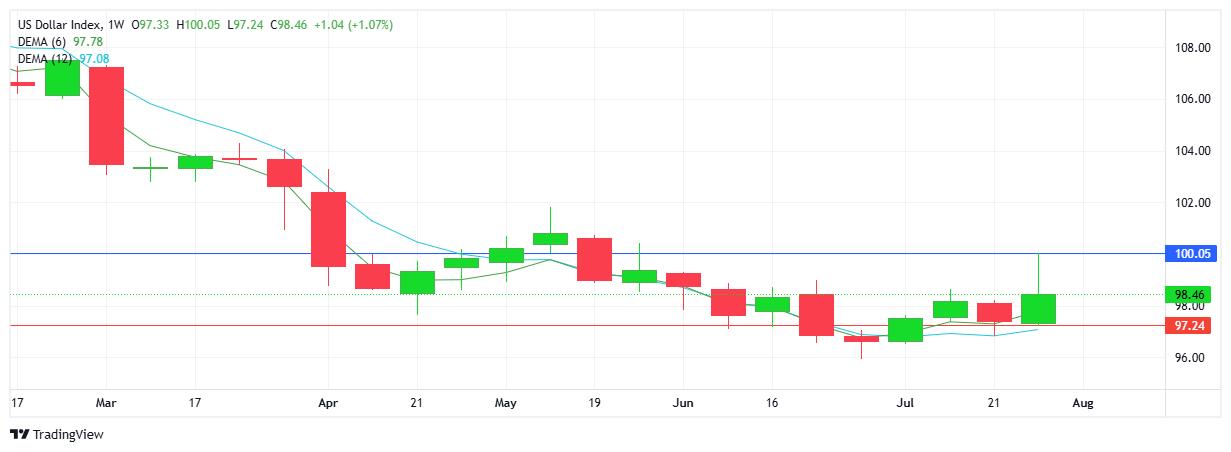
USD INDEX
The trend remains up thanks to a strong and steady 4-day rally from Monday to Thursday. Friday saw a major sell-off following an unexpectedly weak job numbers report. Resistance was set at 100.05 with support at 97.42. The current price sits at 98.46 going into the new week. Buyers will aim to recoup the sell-off while sellers will look to re-establish the overall downtrend which has been in place since the start of the year.
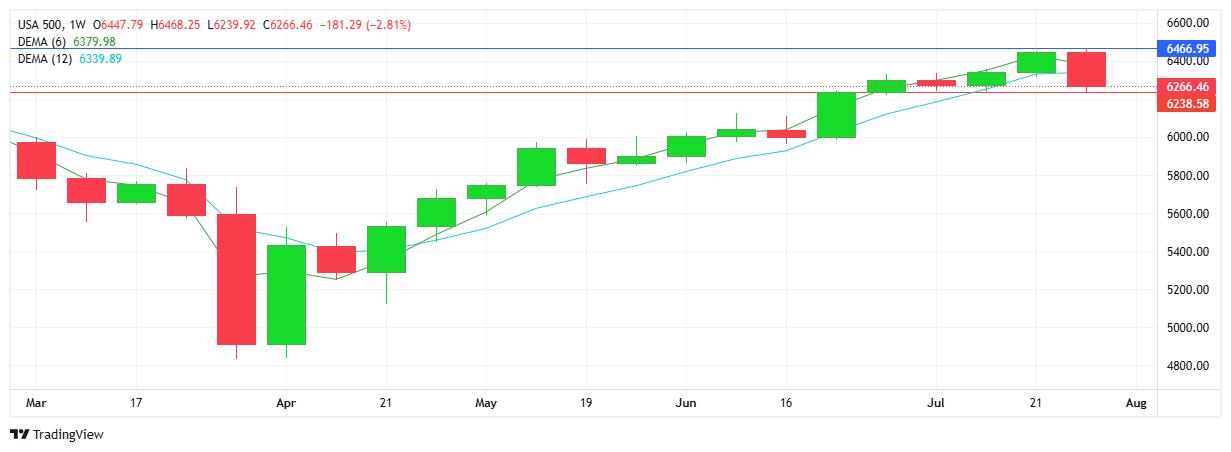
S&P 500
The index was steadily sold-off every day last week, with Friday’s sharp push lower enough to complete a bearish engulfing candlestick - reversal signal. Buyers did establish a record high earlier in the week. Resistance at 6466 with support at 6238. Note the support has been tested and held up earlier in the month. Factors contributing to the downturn appear to be the reality of the April tariff threats coming into effect as well as the unsettled US-China trade deal. The weak labour data contributing to the negative bias.
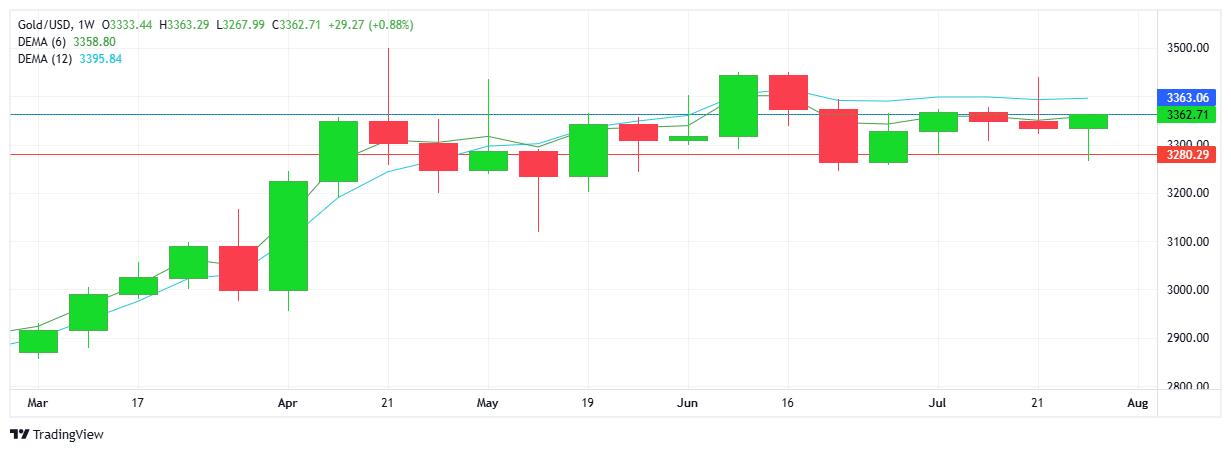
GOLD
The metal was sold early in the week partly in response to the USD index’s rally. Friday’s sell-off in the USD saw gold’s inverse relationship with the global currency play out clearly with the safe haven commodity rallying $70+. Support sits at $3280 with resistance established at $3363. While profit taking and a natural retracement should be considered, buyers will be looking up at $3400. Sellers will look down to the $3300 support area.
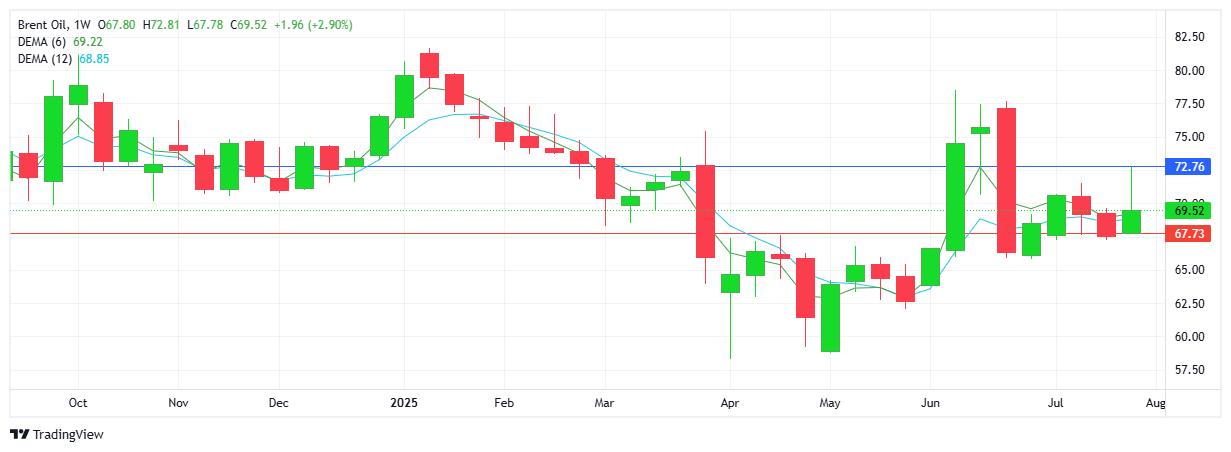
BRENT OIL
Oil started the week on the front foot, only for sellers to step in and give up the majority of the gains. There were early signs with a double top (reversal candlestick formation) on the daily chart. Resistance at $72.76 with support lower at $67.73. The reality of tariff implications which were implemented on August 1 and the threat of a global slowdown were revisited. Buyers will look up at $70, while sellers aim below at the strong $67 support area.
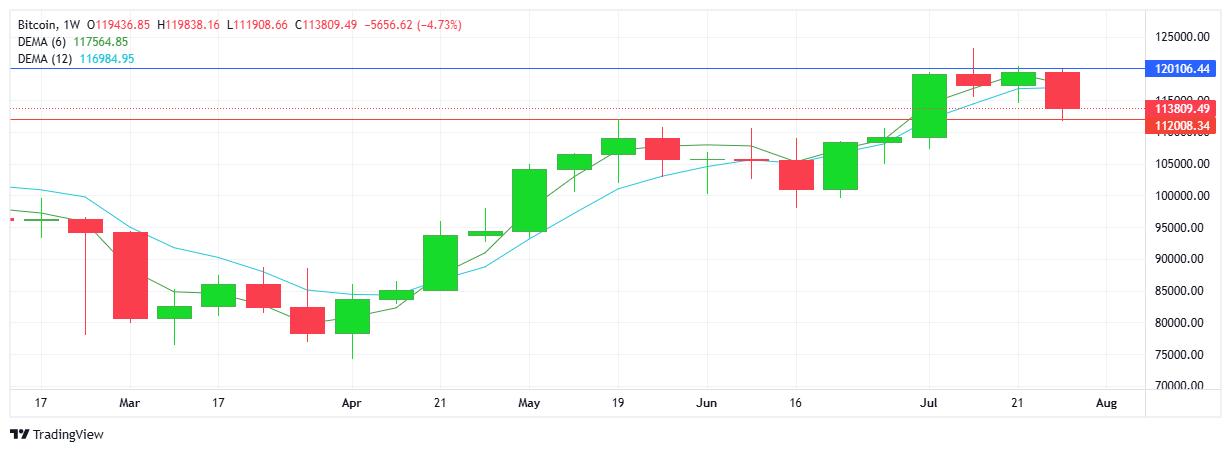
BITCOIN
Sellers dominated the week’s activity with a 3rd successive lower low on the chart. Price action saw activity between $120.1K resistance and $112K support. Note the support matches the high from May 19th - adding relevance to the level. Sellers will look down at the $110K mark in an attempt to extend the move lower, while buyers continue to look up to the $120K on the upside - a level which sellers have guarded successfully since the record high ($123.2k) set in July 2025.