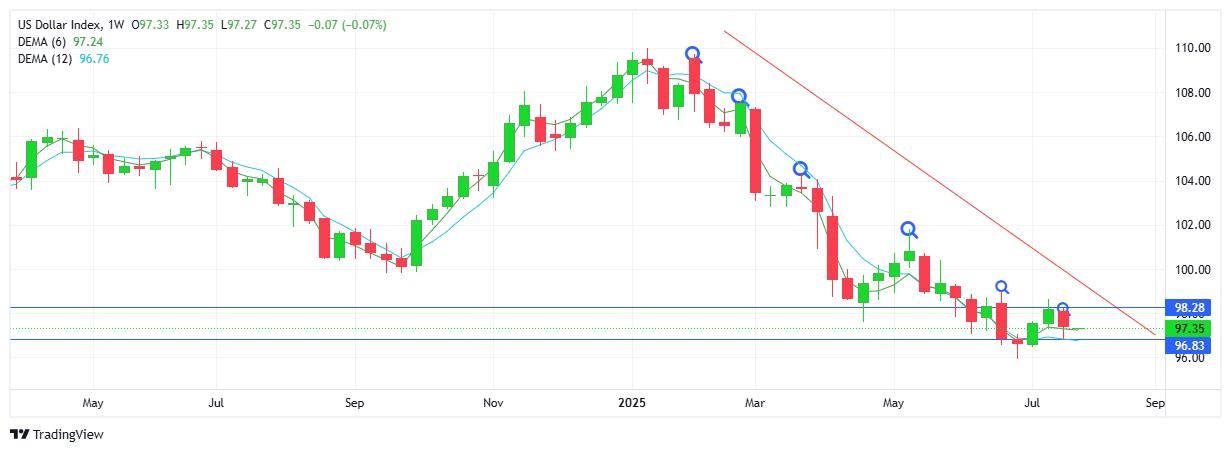
USD INDEX
Sellers dominated the week’s activity with USD weakness across the board - against the major currency pairs and confirmed with the index confirming the negative sentiment. The candlestick reflects a lower high and lower low on the chart. Resistance sits at 98.29 with support established at 96.78. The overall downtrend has been in place since the start of 2025 with a succession of lower highs on the weekly chart.
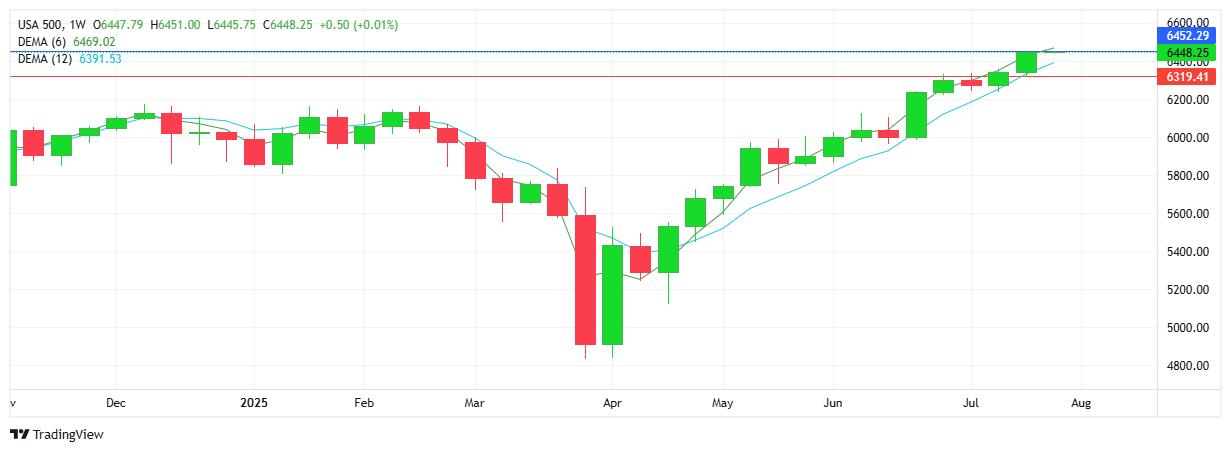
S&P 500
Buyers added to the rally and in so doing set new record highs in the S&P, with strong demand across all the major US stock markets. Note the inverse relationship between weak USD and strong equities playing out. Sellers remain on the sidelines in spite of overbought technicals. While the tariff threat has failed to have an effect on the demand, August 1 is the original tariff/trade deal deadline date and as yet the EU, China and UK have not reached new deals. Resistance stands at 6452 with support holding at 6319.
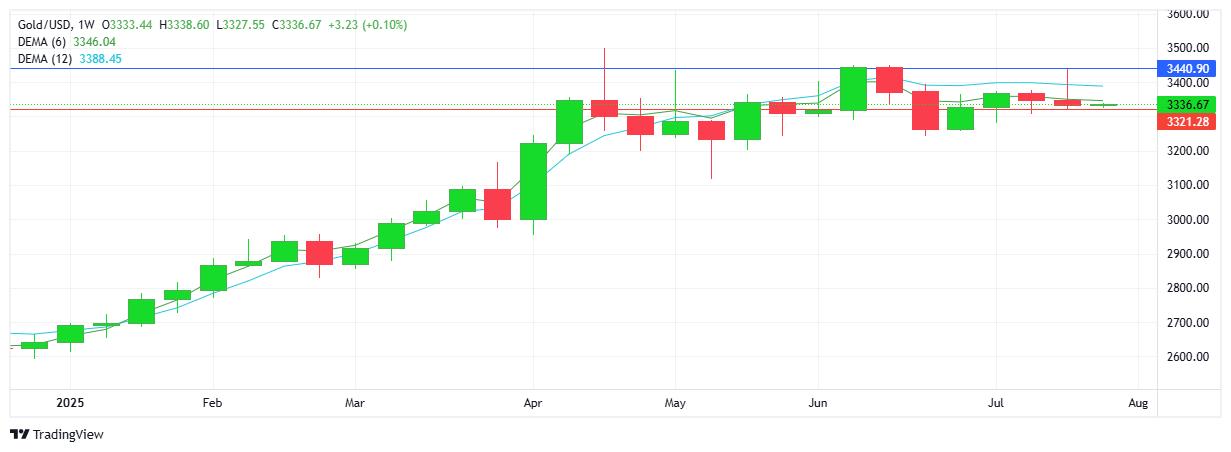
GOLD
Sellers maintained control as the metal continued to trade within a relatively narrow sideways range. Resistance at $3440 with support below at $3321. The bias and trend remain down with a bearish candlestick confirming the downward feel. Note the USD and gold both moving in the same direction lower. So far buyers have protected the $3300 support area vigorously.
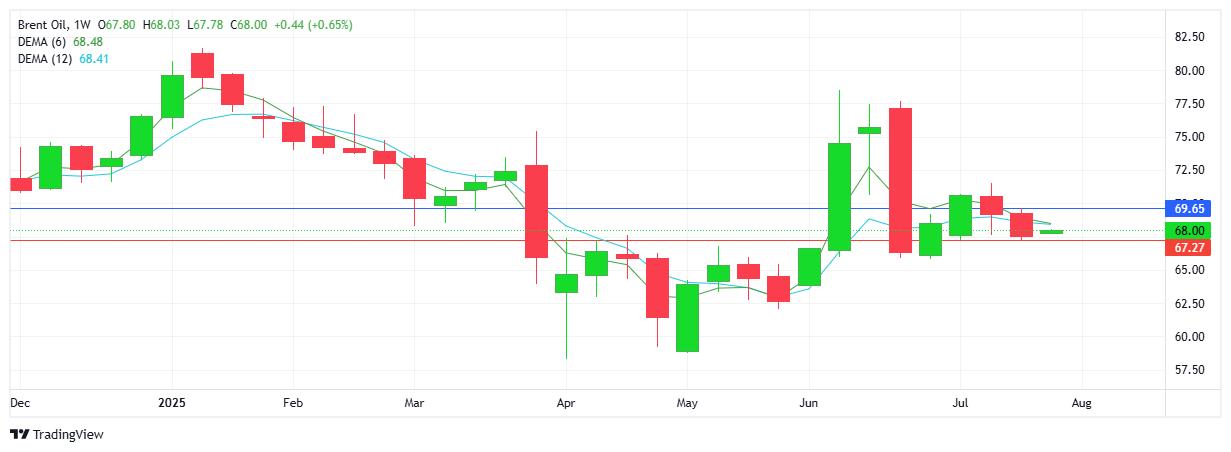
BRENT OIL
Sellers pushed lower for the 2nd consecutive week with a lower high and lower low on the chart. Resistance set at $69.55 with support lower at $67.27. Technical indicators appear to be influencing the market rather than fundamentals like geopolitical conflicts and/or global economic concerns.
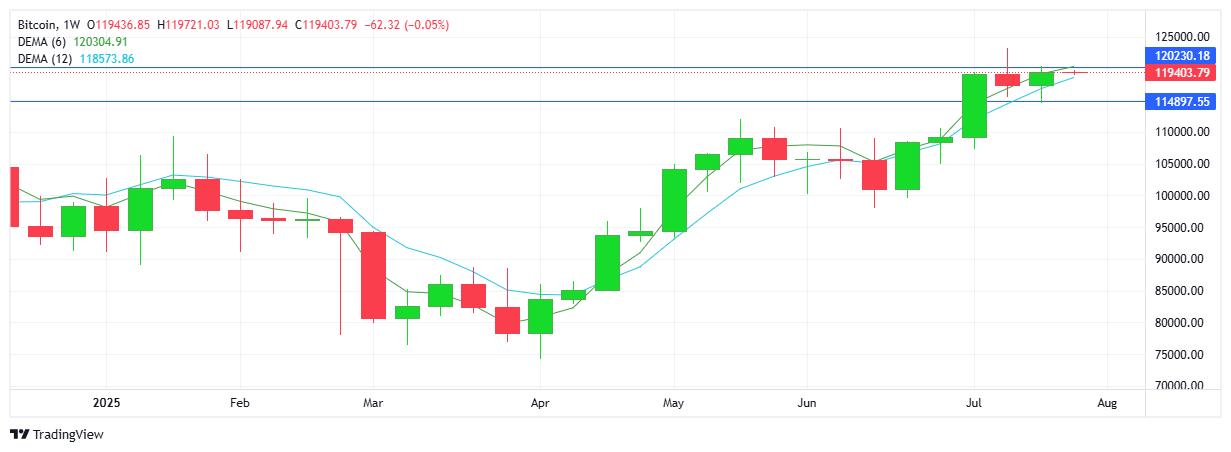
BITCOIN
Buyers won out on the week, although neither buyers or sellers managed to break relevant levels in either direction. Resistance at $120.2K with support at $$114.8K. The meat of the range sits between $117K on the downside and $119K on the upside. Trend, bias and sentiment all favour the upside as buyers aim above $120K.