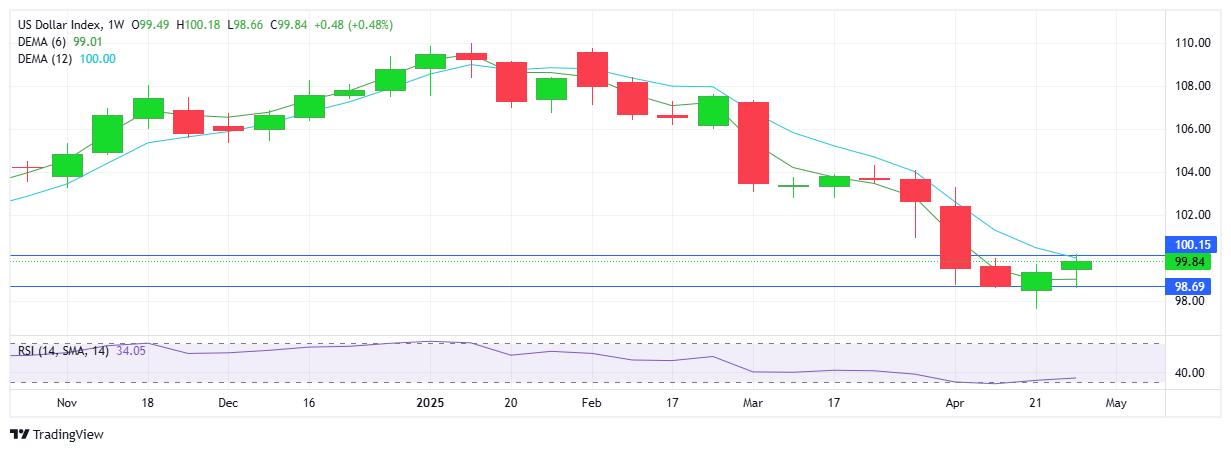
USD INDEX
The USD followed up on last weeks bounce and in so doing broke above the 100.00 mark to establish resistance at 100.15. The big picture reflects the index continuing to trade a full leg lower since the beginning of April with the RSI reading at 34. Buyers will aim to maintain above the 100 level while sellers look down at the 98.69 support. The economic data is mixed with poor GDP numbers and falling yields followed by a strong jobs report. Yet the sentiment indicator appears clear - confirming the negative sentiment surrounding the USD.
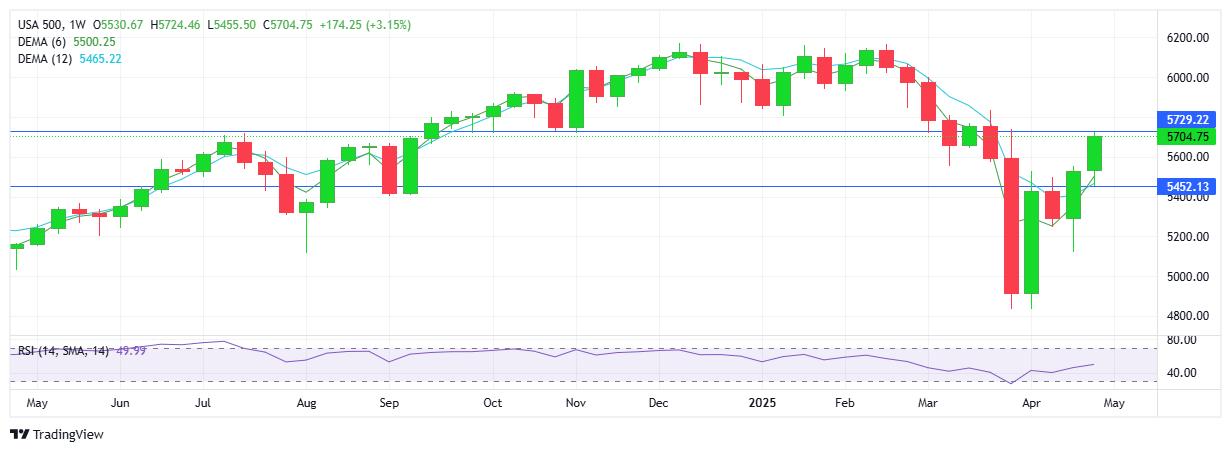
S&P 500
The S&P put in a strong 9 consecutive day rally and the weekly charts confirm a 2nd successive week of higher highs, enough to signal an uptrend with EMAs crossing to the upside. RSI reading at 50 adding technical confirmation for demand in the equity index. Note the relevance of current levels - resistance sits at 5729 which matches the November 2024 support and July 2024 resistance. Buyers will aim to maintain above 5700 while sellers look to test 5600 on the downside as the first target to reverse the uptrend. Also, interesting that the equity index is moving in the same direction as the USDX.
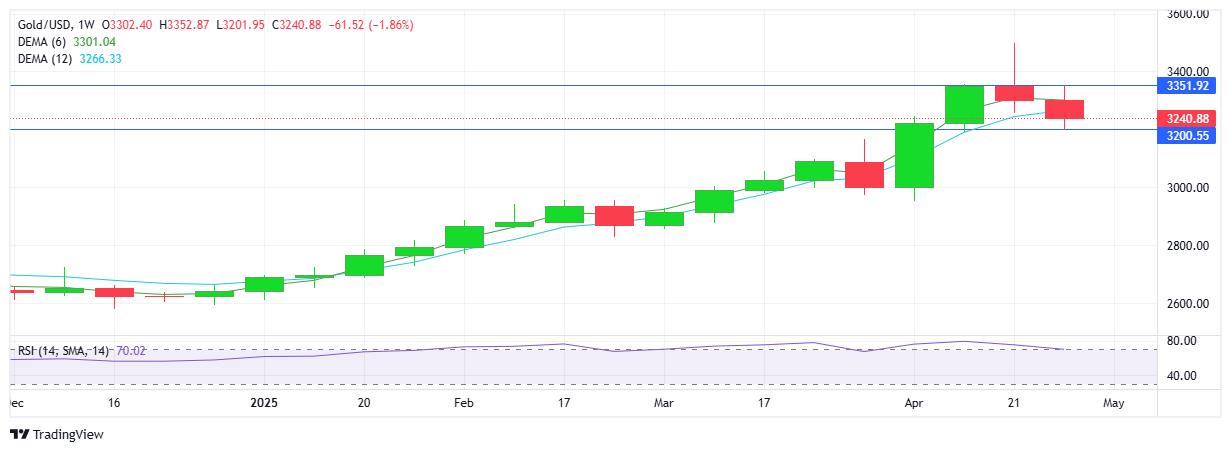
GOLD
A 2nd consecutive week of sellers in control with lower highs and lower lows on the charts - a technical picture we have not seen since November 2024. Resistance sits at $3351with support at $3200. The trend remains up with RSI at 70. While the bias is down, it does seem that the factors influencing the natural retracement stem from profit taking and the inverse relationship with the USD, rather than a change in sentiment as the commodity retains its safe haven status. Buyers may well step in at current levels as the “lower” price holds appeal while perhaps a deeper correction sees price action break below $3200 - either way the demand for gold remains and any new political, economic or geopolitical panic will trigger the bounce up.
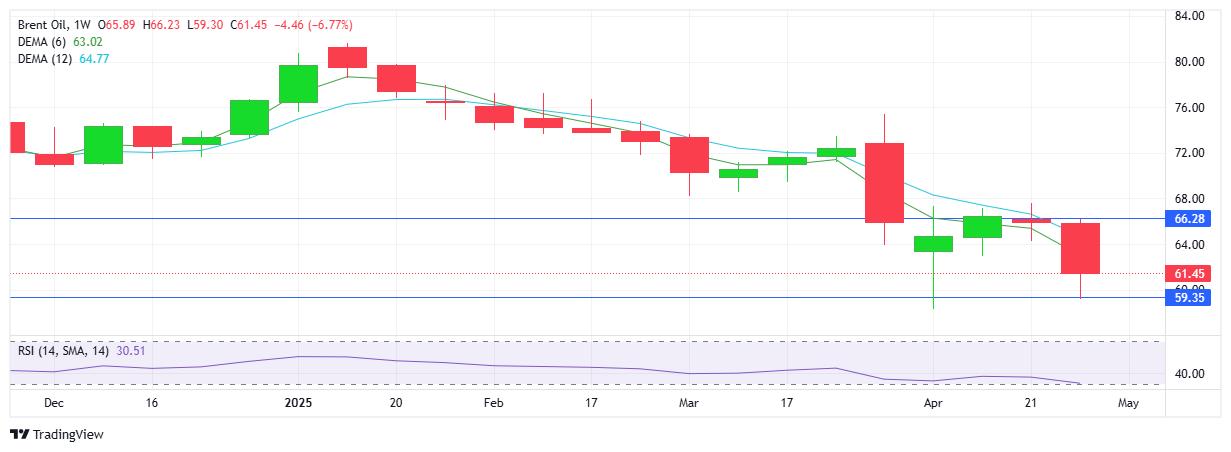
BRENT OIL
Sellers were in total control and went on to retest the 4 year low ($58.40) on the way to establishing weekly support at $59.35. The contributing factors - economic downturn and fears of a global recession resulting from tariff/trade wars, coupled with a lack of supply concerns is keeping buyers on the sidelines with a lack of demand adding to the extreme selloff. Buyers will look to maintain above the $60 mark at a minimum with the RSI of 30 signalling oversold conditions. Should current conditions remain and no new trade deals be reached (particularly between US and China) the $50 mark from late 2020 does not look to be unrealistic.
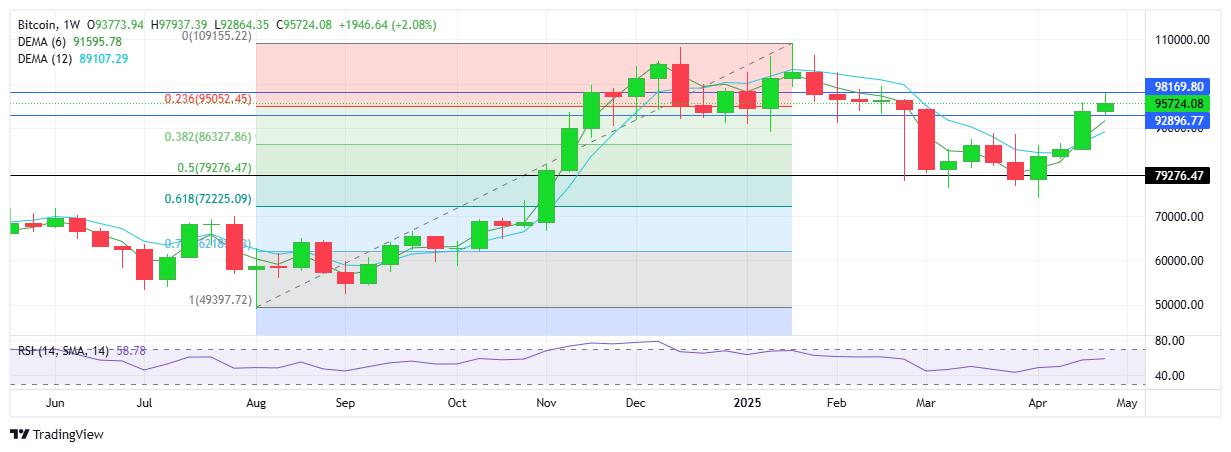
BITCOIN
Buyers added to last weeks gains and confirmed higher highs and higher lows for the 4th consecutive week. The trading range continued to move a leg higher with resistance established at $98.1K with support sitting at $92.8K. Buyers will be looking to retest the psychological $100K mark with an eye on the all-time high of $109K. On the downside sellers will aim below the $90K area. Note the significant fibonacci retracement reading from the preceding uptrend where the retracement down got help up at the 50% level at $79.2K where buyers stepped in to start the current rally.