Market Highlights
1 - US stock markets closed up on the day with DJ leading +0.36%
2 - European indices close mixed with FTSE leading +0.13%, DAX -0.03%
3 - Gold loses $63 at $4456; Bitcoin down $800 at $75K
4 - Oil market remains optimistic as Brent down $3.37 at $92.94
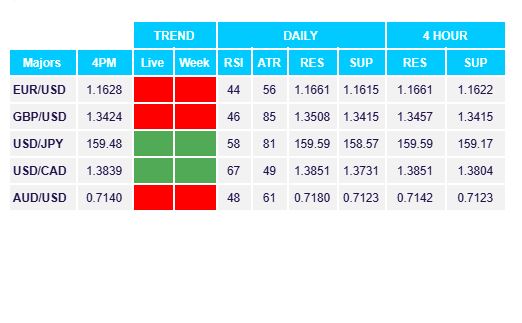
5 - USD gains across the board. EUR -0.06%, GBP -0.19%, AUD -0.45%, JPY +0.17%, CAD +0.24%
Daily Price Activity
Insights
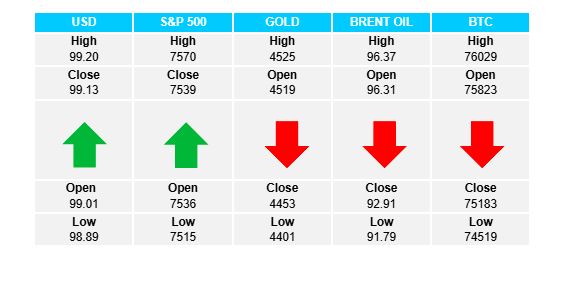
USD INDEX The index moved higher today with the usual contributors: yields higher, safe-haven demand as the geopolitical conflicts remain unsettled (US/Iran), gold weakening and expectations of inflation data remaining sticky (PCE numbers tomorrow). Technically price action remains above the 99.00 mark. Resistance at 99.21 with support at 98.88.
S&P 500 Risk-on, but carefully. Tech and AI continue to support the index. Although the index made the slightest of gains, the doji-like candlestick reflects a lack of direction. Sellers continue to protect the record high resistance level while buyers maintain above the 7500 mark. Resistance at 7565 with support at 7513.
GOLD Sellers added to the downtrend with yesterday’s double-top (bearish signal) playing out. A strong USD contributed, as did the current bout of profit-taking after recent strength. Elevated Treasury yields remain an important driver as well. High oil prices may also have contributed as inflation concerns keeps the Fed away from imminent cuts. Note current support has added relevance since acting as resistance in October 2025. Resistance at $4528 with support at $4402.
BRENT OIL Military threats (from US) and a potential disruption to supply don’t appear to be disrupting the current optimistic theme surrounding the middle east conflict. Even the straits remaining closed has not dampened the optimism. Sellers won out today, adding to the downtrend. Note the current support area - $90 - has held since the war started 3 months ago. Resistance at $96.54 with support at $91.58.
BITCOIN Sellers controlled activity, adding to yesterday’s sell-off as the downtrend remains intact. Technically, note the bearish engulfing candlestick from yesterday playing out, as well as a lower high and lower low on the chart. Sellers will aim to re-test below $75K while buyers look up to re-take the $77K level as a minimum to reversing the trend. Resistance at $75.9K with support at $74.4K.
FX Pivot Levels