Market Highlights
1 - US stock markets close mixed. S&P -0.07%, DJ +0.32%, NASDAQ -0.51%
2 - European indices up on the day. DAX +1.49%, FTSE +1.26%, IBEX +0.75%
3 - Gold up $22 at $4558; Bitcoin down $500 at $76.9K
4 - Brent hovers close to the pivotal $110 level, losing $1.56 at $108.96
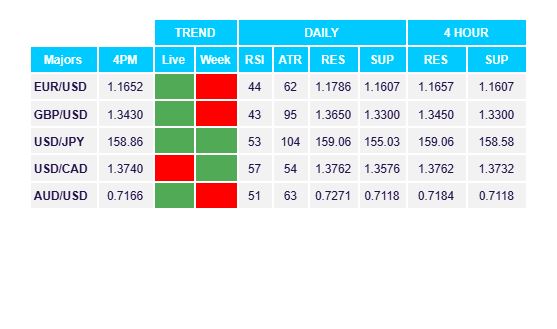
5 - USD down across the board. USDX -0.30%, EUR+0.34%, GBP +0.94%, AUD +0.53%, JPY -0.02%, CAD -0.15%
Daily Price Activity
Insights
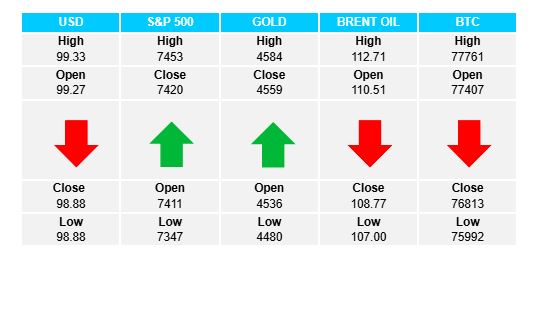
USD INDEX A new week saw the start of a potential reversal with a red daily candlestick putting an end to last week’s rally. Notwithstanding today’s sell-off, the uptrend remains intact with a higher high and higher low on the chart. Buyers will aim to retest above 99.00, while sellers look to add to the move lower. Resistance at 99.32 with support at 98.88.
S&P 500 A gap lower to start the week, a short bounce, and then a close slightly above where the day started. The sharp move lower on Friday, together with today’s initial push lower, reflected in a lower high and lower low - enough to signal a downtrend on the charts. Resistance at 7451 with support at 7375.
GOLD Sellers were first out the block and went on to reach the lowest level since April. The sell-off did not last as buyers stepped in and were able to close slightly up on the day - enough to record a green daily candlestick. Notwithstanding the fight back, the downtrend remains intact with a lower high and lower low on the chart. Resistance at $4581 with support at $4479.
BRENT OIL No news is not good news as neither buyers or sellers held onto intraday moves in either direction. While the straits are not open to safe shipping and Iran shows no signs of giving up control of the passageway, prices continue to hover close to the $110 mark - the new dividing line within a nervous and unsettled oil market. The US continuing to make drastic threats against Iran adds to the fragile status quo. Resistance at $112.88 with support at $107.02.
BITCOIN A 4th consecutive down day with lower highs and lower lows, and a 7th red candlestick over the past 8 days all contribute to the current downtrend. Note the relevance of current support level - was tested (unsuccessfully) April 29th, and the level acted as resistance earlier this year (March 17th). Resistance at $77.8K with support at $76K.
FX Pivot Levels