Market Highlights
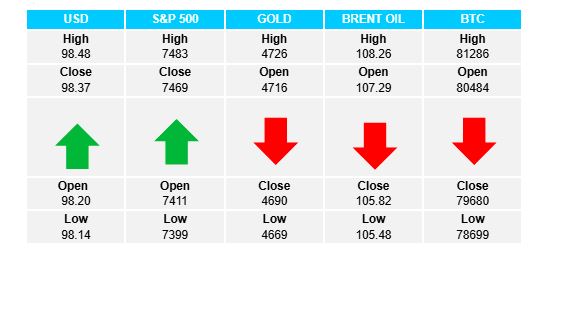
1 - US stock markets close mixed. S&P +0.58%, DJ -0.14%, NASDAQ +1.20%
2 - European indices down on the day. DAX -0.96%, FTSE -0.82%, IBEX -0.53%
3 - Gold -$28 at $4688; Bitcoin -$1K at $79.4K
4 - Brent hovers close to $105 - above $100 “the new normal” with no new developments
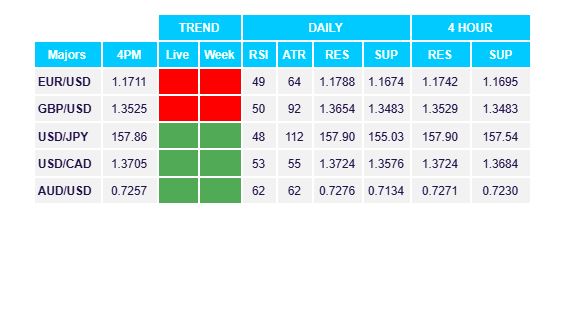
5 - USD strengthens against EUR -0.16%, GBP -0.06%, JPY +0.13%, CAD +0.12%. AUD outlier, strengthening against USD +0.36%
Daily Price Activity
Insights
USD INDEX Buyers responding to hot inflation data which will have Fed feeling hawkish; a nervous middle east stalemate brings USD safe haven status to the fore; US yields up…all contributing to demand for USD. Uptrend intact with higher highs and higher lows on the chart. Resistance at 98.48 with support at 98.13.
S&P 500 AI earnings growth overpowers sticky inflation as buyers continue to dominate with another record high on the index. Perhaps the oil shock is over as investors do not want to miss out on the stock market rally. Unusual that USD and stocks move higher, rather than the traditional inverse relationship. Resistance at 7481 with support at 7409.
GOLD Gold continues to remain relatively flat as it does not wander far from the new $4700 comfort zone. The sideways activity tends to have a downward bias with a 2nd consecutive red daily candlestick. Although demand for the metal has been limited, the safe haven commodity continues to show resilience in the face of a rallying USD. Resistance at $4731 with support at $4668.
BRENT OIL The unsettling stalemate between US and Iran, translates to a relatively calm oil market as prices continue to hover between $105 and $108. No positive news to bring sellers into the equation, with no new developments as the market gets comfortable trading above the $100 mark. Trump “reminds” that prices could have been closer to $200 as a result of the conflict. Resistance at $108.49 with support at $105.40.
BITCOIN A 3rd consecutive red daily candlestick, a 3rd consecutive lower high and lower low on the chart, and once again BTC is in a downtrend. Note the ascending trend-line broken to the downside. A bounce up late in the US session sees prices back at the pivotal $80K level as the trading day draws to a close. Buyers guarding the support area for now. Resistance at $81.4K with support at $78.7K.
FX Pivot Levels