Market Highlights
1 - US stock markets close higher to start the week. S&P +0.12%, DJ +0.13%, NASDAQ +0.20%
2 - European indices close mixed amid a bearish mood. DAX -0.2%, FTSE -0.6%
3 - Gold unchanged at $4681 within current downtrend; Brent adds $0.53 closing at $101.81, noticeably above the $100 mark
4 - Bitcoin unable to hold on, losing $1700 on the day to close $76.9K
5 - USD down across the board, led by strong commodity currencies. CAD -0.35%, AUD +0.61%
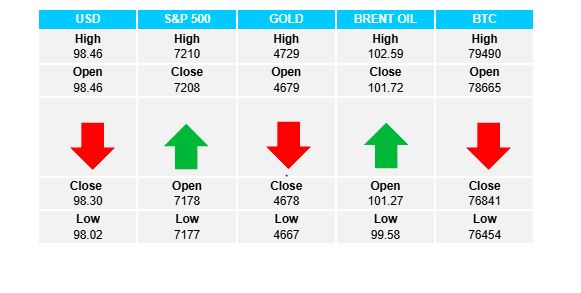
Daily Price Activity
Insights
USD INDEX Despite buyers controlling the US session, the chart reflects a red daily candlestick with a lower high and lower low on the day. Note the double-top, the bearish signal playing out. While the uptrend remains in place, (technically the leading indicator sits above the lagging indicator), practically the MA’s are running parallel as price activity maintains around the 98.00 mark adding to the sideways feel. Resistance at 98.49 with support at 98.02.
S&P 500 The month-long uptrend continues with a new record high to start the week. Today’s higher high and higher low adds to the uptrend confirming demand for US equities. Investors continue to favour US equities as the asset of choice as the risk on theme sees the USD and gold take a back seat to the rallying stock markets. Resistance at 7208 with support at 7173.
GOLD A doji-like candlestick adds to the downtrend, while at the same time reflecting a certain amount of indecision relating to the safe haven commodity. Note the lower highs which contribute to the bearish feel. Although sellers controlled the day’s activity, buyers continue to guard the current support level for now. Resistance at $4730 with support at $4669.
BRENT OIL With no real material change to current situation, the chart confirms the bullish bias with a higher high and higher low adding to the uptrend. Noticeably end of day price sits above the $100 mark which reflects the market’s uneasiness and uncertainty, tending towards further conflict, rather than a potential settlement (which would see prices below the pivotal mark and closer to the $90 level). Resistance at $102.32 with support at $99.58.
BITCOIN Sellers put in a strong reversal day as buyers once again got held up at the $79K resistance area. Technically the chart reflects a double-top and bearish engulfing pattern on the daily chart - both bearish signals. On the downside sellers will target $75K which coincides with the ascending trendline. Resistance at $79.5K with support at $$76.4K.
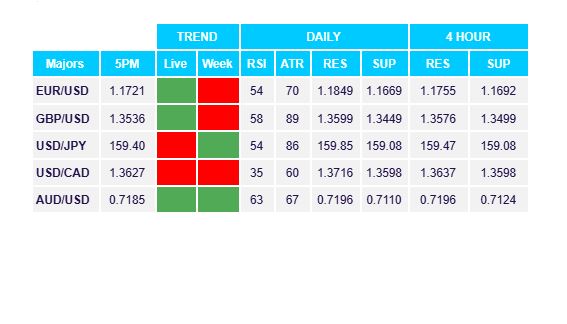
FX Pivot Levels