Market Highlights
1 - Brent oil price rises amid middle east standoff; up $5 at $100.87
2 - US equity markets close lower. S&P -0.41%, NASDAQ -0.89%
3 - European stock markets end day mixed. DAX -0.05%, FTSE -0.2%, IBEX +0.8%
4 - Bitcoin unchanged at $78K; Gold down $36 at $4691
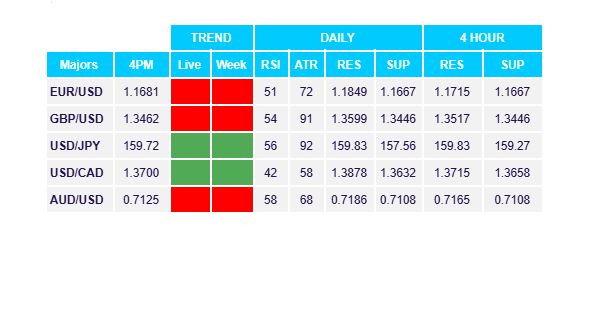
5 - USDX +0.25%; Commodity currencies lead way, AUD -0.46%, CAD +0.22%
Daily Price Activity
Insights
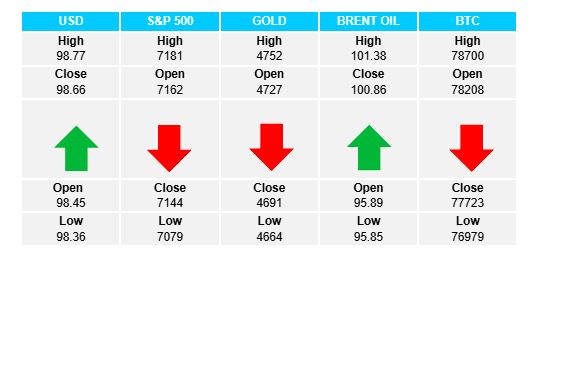
USD INDEX Demand for USD continued for the 3rd consecutive day, adding a higher high and higher low to extend the uptrend. The ceasefire/settlement mood regarding the middle east conflict seems to have been replaced with aggressive threatening rhetoric, as parties appear further apart than closer to reconciliation. Resistance at 98.77 with support at 98.36.
S&P 500 Today’s red candlestick confirming sellers won out on the day, notwithstanding a rally late in the US session. The volatile nature of the market saw a brief intraday test of the record high which now reflects as a triple top candlestick pattern (bearish signal). The uptrend remains intact as price activity continues to be contained within a 5- day sideways range. Note the resilience as demand for equities confirmed with a rally into the close. Resistance at 7186 with support at 7077.
GOLD Sellers added to the downtrend with a lower high and lower low on the chart. Note the strong daily support again defended by buyers. The move lower is in contrast to the USD moving higher - the inverse relationship between the 2 assets. Resistance at $4751 with support at $4660.
BRENT OIL Buyers confirmed the unsettled middle east conflict has tilted from the safe zone - $90 - $95, up to an intraday break above the pivotal $100 dividing line as the fragile ceasefire and a US blockade in the straits of Hormuz tilt sentiment away from a peaceful settlement. Resistance at $101.34 with support at $95.64.
BITCOIN A narrow range (under $2K) with neither side holding onto moves resulted in a slight red candlestick, although the uptrend and bullish feel remain in place. Today’s candle marks the 3rd consecutive higher low on the chart. Resistance at $78.6K with support at $76.9K.
FX Pivot Levels