Market Highlights
1 - US stock markets lower on tariff uncertainty. S&P -1.13%, DJ -1.66%, NASDAQ -1.13%.
2 - European indices mixed. DAX -1.05%, FTSE -0.29%, IBEX +0.18%
3 - USD mixed to start the week. JPY outperforms -0.23% on the day; USD/CHF lower, near 0.7741
4 - Goldman Sachs forecasts $5400 gold on central bank demand and rate cuts. Today up $120 at $5226
5 - Bitcoin struggles to find buyers as downtrend continues. Closes at $64.2K
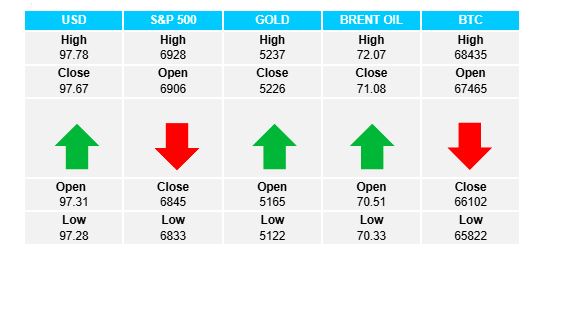
Daily Price Activity
Insights
USD INDEX Following a gap down to start the week, buyers fought back with steady gains through the day. Aside from today’s activity resulting in a lower high and lower low on the chart, the daily uptrend remains intact. Current resistance area has held strong through February as buyers once again look up to the 98.00 mark. Note the strong USD, weak equities (traditional inverse relationship) played out today. Resistance at 97.78 with support at 97.28.
S&P 500 A steep sell-off as US equity markets turned lower across the board. Next downside target will be a test of the ascending trend-line, which will coincide with a test of the 68.00 support area. Note buyers have guarded current support levels since the start of the year. Resistance at 6928 with support at 6832.
GOLD A strong start to the week as demand for the metal secured a 4th consecutive higher high and higher low as the uptrend gained momentum. Fundamentals and technicals favour the upside as sellers appear content remaining on the sidelines for now. Resistance at $5240 with support at $5099.
BRENT OIL Notwithstanding a sell-off through the US session, early gains were enough to secure a green daily candlestick with the uptrend firmly intact. A nervous oil market continues to hang on unsettling rhetoric relating to the US/Iran conflict. Resistance at $72.07 with support at $70.31.
BITCOIN Sellers continue to dominate trading activity with limited demand for the cryptocurrency. Bounces on the shorter time-frames run out of steam early as buyers fail to add to intraday moves. Should sellers maintain pressure, the $60K level is the next downside target. On the upside, the 70K mark remains the first real level to be tested in order to reverse the trend. Resistance at $67.7K with support at $64.1K.
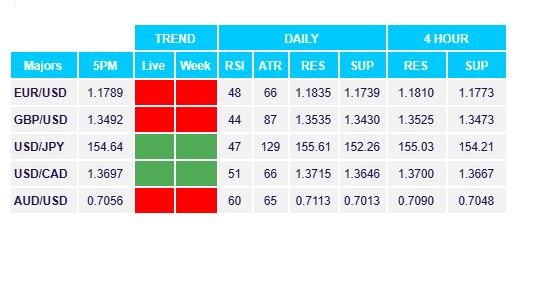
FX Pivot Levels