Market Highlights
1 - Morgan Stanley drops December Fed cut call following strong September jobs report
2 - Unexpected price action in a big stock market reversal; S&P - 1.55%, NASDAQ -2.2%; Nvidia turned an initial 6% gain into a 3% loss
3 - WTI crude down $0.17 to $59.14; gold down $5 to $4075; US 10yr yields down 3bps
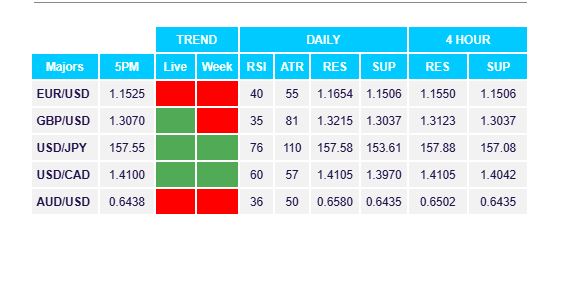
4 - GBP leads, AUD lags; USDCAD runs to upside for 2nd consecutive day; Japan continues with verbal intervention
5 - Bitcoin is now lower year vs year, lower than last November; breaks below $90K
Daily Price Activity
Insights
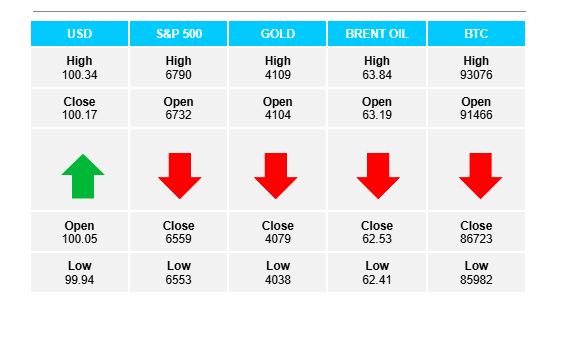
USD INDEX The USD continued higher, closed with a 5th consecutive higher high and higher low on the chart, confirming demand for the world’s reserve currency. A strong labour report contributed to the trend, regardless that the report was for September. Typically, strong jobs numbers could add to the Fed holding, rather than cutting rates. Noteworthy that price activity maintained above the 100.00 level. Resistance at 100.37 with support at 99.93
S&P 500 The US stock markets were sold off sharply, with the S&P index adding to an already well- established downtrend. Sellers broke below the previous 6600 support area with buyers standing on the sidelines. A strong USD set the tone for the sell-off, and then momentum picked up steam late in the session. Resistance at 6791 with support at 6553.
GOLD While the USD and equity markets both had strong moves (in opposite directions) with volatility and momentum at high levels, gold seems content to take a breather. The metal’s safe haven status is not in question, yet traders appear to be looking elsewhere, for now. Limited intraday moves have seen the metal close around the $4050 area since the start of the week. The pivotal $4000 level continues to be guarded by buyers, while sellers have contained prices below the $4100 area. Resistance at $4110 with support at $4038.
BRENT OIL Sellers added to yesterday’s move lower and settled at the bottom of the now well-established range between $62 and $64. A 5th consecutive lower high on daily chart. Trend, bias and sentiment all tilted downwards on all time frames - 4hr, daily and weekly. Resistance at $63.89 with support at $62.39.
BITCOIN As the cryptocurrency continues to trade in unfamiliar territory, sellers are in complete control with technicals, fundamentals and sentiment all contributing to the steep decline. A $20K sell-off from $107K (November 11th) down to $86K (November 20th) in just 10 days. In the absence of established levels within the current environment, buyers have not yet stepped in to halt, if not reverse the trend. Oversold technicals and profit taking have not yet entered the picture. Technical analysis on the shorter time frames may provide entry and exit points, ie. intraday resistance and support levels. Resistance at $93K with support at $85.9K.
FX Pivot Levels