Market Highlights
1 - Major indices close lower, although recovery into the close erases some bearishness
2 - WSJ: broad support to hold rates steady
3 - Major European indices close mixed; German DAX and Italy’s FTSE lower, UK FTSE higher
4 - US yields close mostly lower; 10 yr -1.1bps
5 - Bitcoin up $1.5K to close $114.4K; Gold up $36 to close $3349
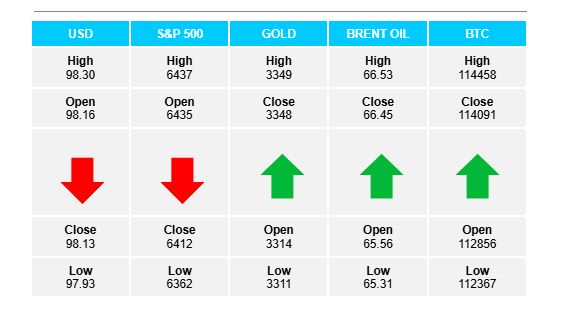
Daily Price Activity
Insights
USD INDEX Buyers and sellers tried higher and lower respectively, before the price settled back where it started, marginally lower on the day. The doji-like candlestick reflects the indecision, as well as the stand-off following a 2-day rally. Price activity has hovered close to the 98 area for the past week. Resistance at 98.32 with support lower at 97.93.
S&P 500 Although buyers did put in a late rally, sellers won out for the 4th consecutive day, with lower highs and lower lows adding to the downtrend. Technically the bias turned higher as the late reversal did enough to signal an uptrend on the shorter timeframes (hourly) with the EMAs crossing to the upside. The daily candlestick, although red, is bullish. Resistance at 6440 with support down at 6362.
GOLD The metal had a strong day bouncing up off the support area and recouping losses from the past three days. Noteworthy that gold rallied despite the USD remaining flat on the day. Today’s bullish candle started out as a double-bottom on the chart as buyers controlled the day’s activity. The safe haven commodity continues to maintain above the $3300 level. Support at $3311 with resistance established at $3350.
BRENT OIL Buyers stepped in for the 4th time in the past 6 days confirming the strong support level. Price activity remains confined to the weekly range which is trading a leg lower than the previous week. Support at $65.29 with resistance set at $66.54. The trend remains down with the $67 level marking the lower high on the daily chart. Lack of new fundamentals continues to see the market moving sideways rather than making a significant move in either direction.
BITCOIN Buyers bounced up off support, confirming the pivotal and relevant $112K area. Support at $112.2K with resistance at $114.4K. While the downtrend remains intact, EMAs on both the 4hr and hourly charts have crossed to the upside. Sellers remained on the sidelines which reflects technically as the close and resistance matching on the daily candlestick - a strong indication of further upside potential going into the new trading day.
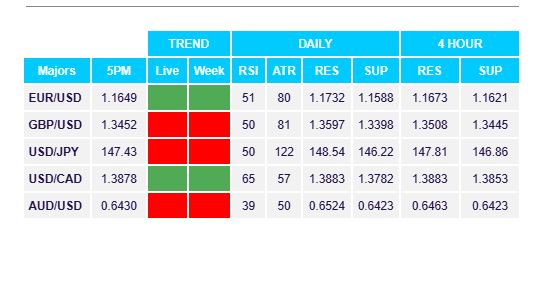
FX Pivot Levels