Market Highlights
1 - NASDAQ closes higher, S&P closes lower for 2nd consecutive day; Meta and Microsoft the gold standards for stocks
2 - USDCAD breaks above 100 day MA. BoC holds rates amid trade uncertainty
3 - Fed Powell does not commit to future policy. Will wait for 2 sets of inflation numbers before September meeting
4 - USD rallies as all major pairs near extreme levels at the close of the day
5 - Major European indices close mostly higher; Gold lower with the higher USD
Daily Price Activity
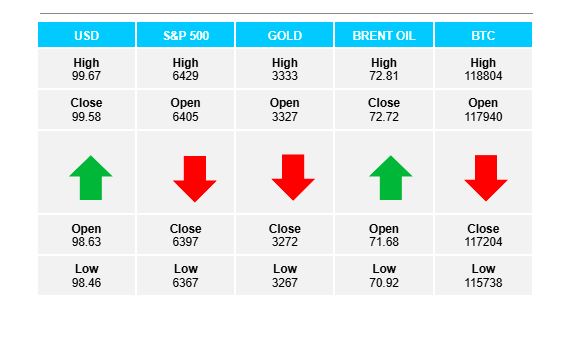
Insights
USD INDEX For a 5th straight day, the index rallied with higher highs and higher lows confirming the demand for USD. Strong GDP data coupled with the trade deals being finalized seen as US positive, have provided the fundamental factors contributing to the uptrend. Resistance set at 99.70 with support lower at 98.47. Note technical indicators reflect the index approaching overbought readings.
S&P 500 A 3rd consecutive red day with lower highs and lower lows on the charts. EMAs have crossed to the downside. Resistance at 6429 with support lower at 6363. The retracement follows a series of record- breaking highs since the tariff inspired rally (April 9) and the market could be taking a natural breather rather than initiating a full reversal. The current downturn appears to be more a lack of demand, than sellers stepping in aggressively.
GOLD The traditional inverse relationship between strong USD and weak gold played out today. Buyers did not step in as sellers broke below the significant $3300 support level. Resistance set at $3334 with support established at $3268. Note the 3rd attempt to break below current support area. With an apparent lack of current geopolitical factors fuelling demand, buyers may rely on technical analysis and the relevance of retaking the pivotal $3300 level. Surely the metal has not lost it’s safe-haven status?
BRENT OIL Another strong day for oil saw buyers in control and pushing higher for the 3rd consecutive day, adding $5 since the start of the week ($67.60 to $72.73). Resistance at $72.81 with support at $70.82. The contributing factors, namely strong US data supporting a solid US economy, coupled with Trump’s tariff deals which have yet to show a negative effect on the economy (at least for the USA) have kept sellers on the sidelines for now.
BITCOIN Sellers continued to push the cryptocurrency lower with a 3rd consecutive day of lower highs and lower lows on the chart. Note the loosely formed descending triangle which shows the current low matching the base of the triangle. Resistance at $118.7K with support at $115.6K. Adding to the bearish bias is the fact that $117K support has been broken while the $120K resistance has not been challenged since the record high of $123K (July 14).
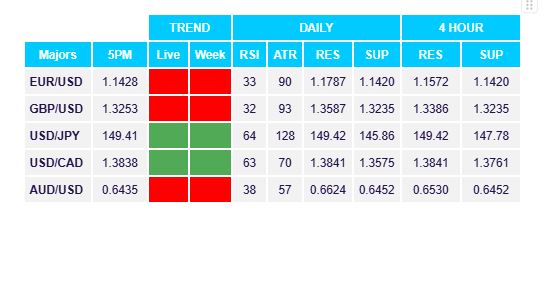
FX Pivot Levels