Market Highlights
1 - S&P and NASDAQ indices close higher and at new records
2 - Crude oil futures settle at $66.71; Trump: Fed has to cut rates
3 - Major european indices closing lower to start the week, DAX worst performer -1.13%
4 - Euro slumps on trade deal backlash; US higher against majors following EU-US deal
5 - US debt market - yields close higher across the board, 10yr +2.8 bps, 30 yr +3.0 bps
Daily Price Activity
Insights
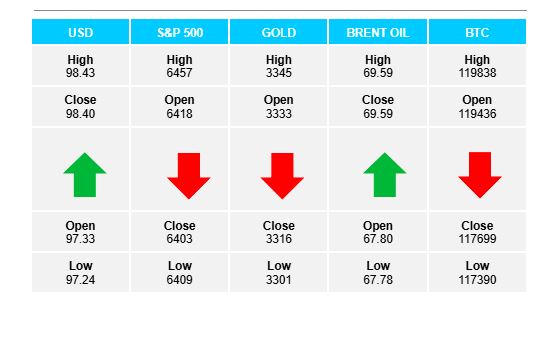
USD INDEX The index reversed to the upside as demand did not let up from start to finish. Resistance sits at 98.42 with support lower at 97.24. Buyers will test this resistance area for the 3rd time since June 17, 2025. The rally to start the week appears to be based on strong US data, a tariff deal with the EU being reached, and perhaps a lack of any of the majors to seriously challenge the global reserve currency. Negative USD sentiment was nowhere to be seen.
S&P 500 While sellers did win out on the day, it was not before a new record high established before the opening bell. Resistance set at 6458 with support lower at 6409. Trading closed alongside Friday’s close at 6422. The steady uptrend remains in place with a higher high and higher low on the chart. August 1 remains deadline trade deal date - perhaps demand remains in place until the market learns more about a China-US deal.
GOLD The metal moved lower for the 4th consecutive day with lower lows and lower highs on the chart. The sell-off was in keeping with the inverse relationship between strong USD and weak gold. Resistance at $3345 with support $3301. Buyers continue to guard the $3300 level. Traders seemed to pay little attention to the commodity’s safe haven status in today’s activity. Big picture shows gold’s recent comfort zone remains between $3300 and $3400.
BRENT OIL Oil put in a strong showing wiping out last week’s losses. The big push higher was enough to signal an uptrend as the EMAs crossed to the upside, although the big picture sideways trend remains intact. Resistance established at $69.62 with support lower at $67.69. Note the strong support area where buyers have continued to step in since the start of the month. Again, it appears the activity is driven by technical indicators rather than fundamental influences.
BITCOIN Trade activity continues to range between $120K on the upside and $117K on the downside. Buyers and sellers traded blows with neither side able to make a substantial break in either direction. Resistance at $119.8k and support lower at $117.3K. The trend runs sideways for now, with perhaps the bias tilted slightly to the upside based on the strong support level and the pattern of breaks to the upside following prolonged sideways activity.
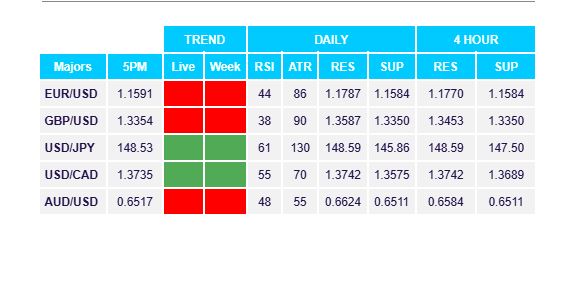
FX Pivot Levels