Market Highlights
1 - US stock markets close mixed; Major european indices close higher
2 - Crude up $0.35 to $68.28, Will oil fall to $60?
3 - USD ends day mixed: up vs Yen, GBP and down vs EUR, CHF and AUD
4 - NZD bounces up and down awaiting RBNZ rate decision; RBA delays cut for now
5 - Ethereum’s next move could be a plunge or short squeeze
Daily Price Activity
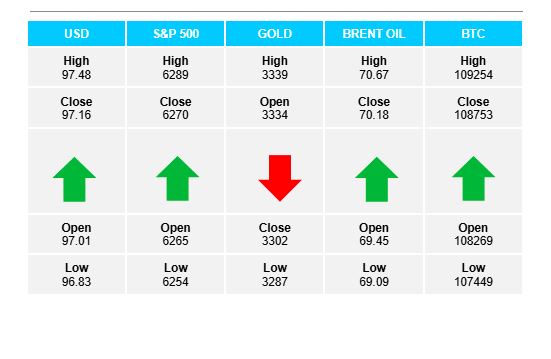
Insights
USD INDEX A green daily candlestick, a higher high and higher low adding to the uptrend. However, it’s not that straight forward. There was a gap lower to start the new trading day and following an early rally and late sell-off, the close price was lower than yesterday. Resistance was set at 97.49 with support lower at 96.81. Note the fib retracement tool measured from the 99.00 high to the 96.00 low - the rebound has been held up at the first fib retracement level (38.2%) at 97.15.
S&P 500 A gap lower to start and notwithstanding the slight green daily candlestick, the market never did recover. A lower high and lower low adding to the downtrend. Resistance at 6290 with support established at 62.53. Although sentiment has been positive surrounding the major equity markets, deadline dates and ad-hoc extensions regarding tariffs has created uncertainty and as such, a lack of demand as buyers appear cautious.
GOLD A similar start to yesterday with the metal being sold off early, yet unlike yesterday buyers did not step in to recoup losses. A lower high and lower low confirming the downtrend. Resistance sits at $3340 with support below at $3286. Note the series of lower highs since June 16th. Again the pivotal $3300 area held up as buyers protect the level.
BRENT OIL Buyers maintained control adding to yesterday’s gains. Support sits at $69.06 with resistance established at $70.66. Significant that the $70 level was broken to the upside. The gentle demand stems from ongoing geopolitical instability creating potential supply concerns.
BITCOIN A little noise from both sides, with neither buyers or sellers able to move out of the relatively narrow range between the $107.4K support and $109.2K resistance on the upside. While buyers did enough to justify a green candlestick, the trend remains sideways with the EMAs flat. Buyers continue to fail at the $109 - $110K, as sellers get held up at the $107K support area.
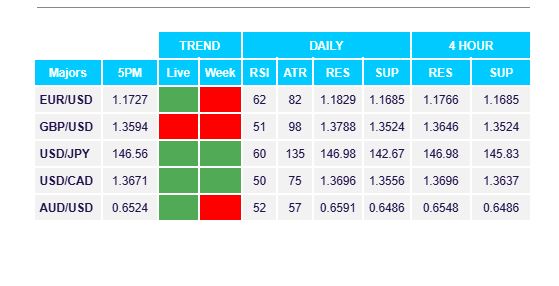
FX Pivot Levels