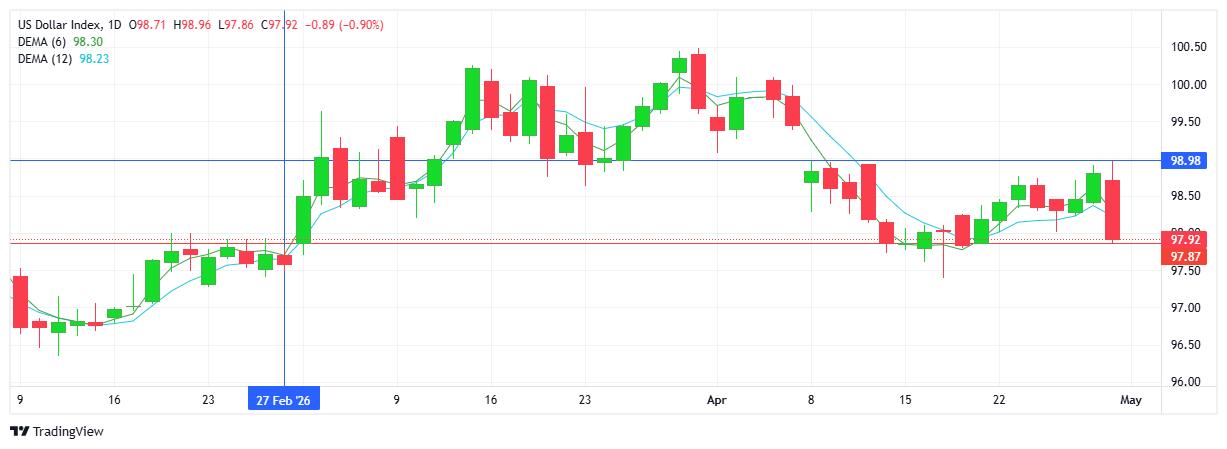
USD INDEX
The strong reversal confirmed a new downtrend on the index. Bearish engulfing candlestick could signal further weakness to follow. BOJ’s verbal intervention triggered a broad USD sell-off, oil prices dropped after yesterday’s spike, risk-on saw equity markets rally?all contributing to broad USD weakness which has been in place for 2026. Note buyers have protected current support throughout the month. Resistance at 98.98 with support at 97.87.
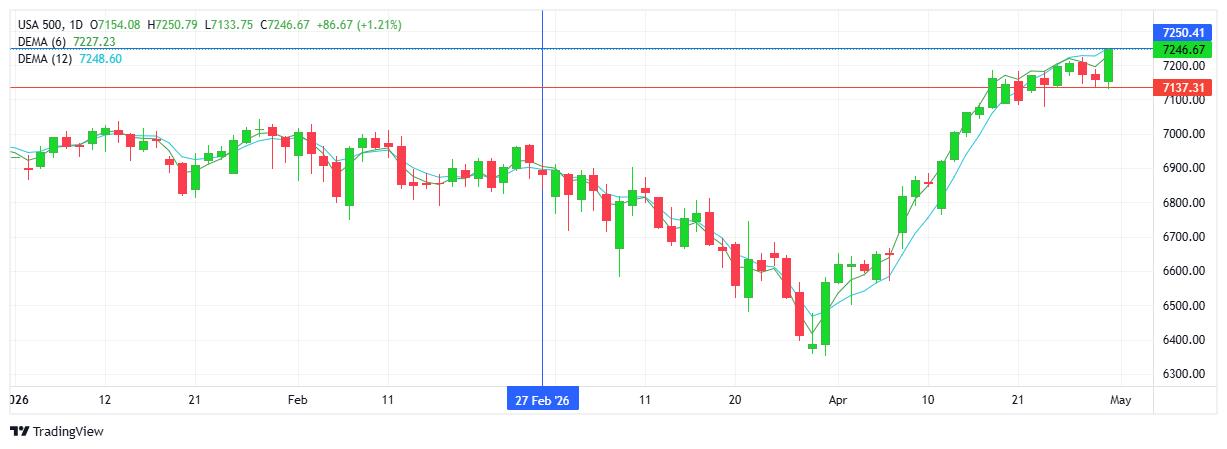
S&P 500
Buyers controlled activity across major US stock markets, with the index setting yet another record high. Strong earnings, oil prices dropped, end of month flows?all this in the context of April recording one of the best months since 2020. The rally confirmed the inverse relationship between weak USD and strong equities. Resistance at 7250 with support at 7137.
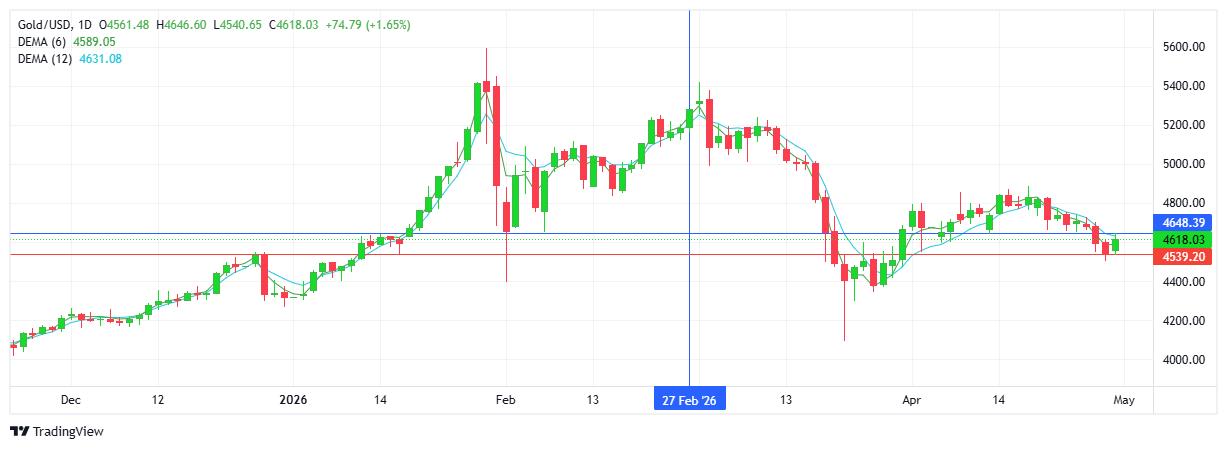
GOLD
Buyers halted the steady downtrend, guarding the current support area, as was the case yesterday. Demand for the metal appears rather limited, bearing in mind the USD’S strong sell-off and the commodities safe haven status in regard to the middle east war. Buyers will aim to maintain and add to gains above $4600, while sellers look down at retesting the $4500 support area. Resistance at $4648 with support at $4539.
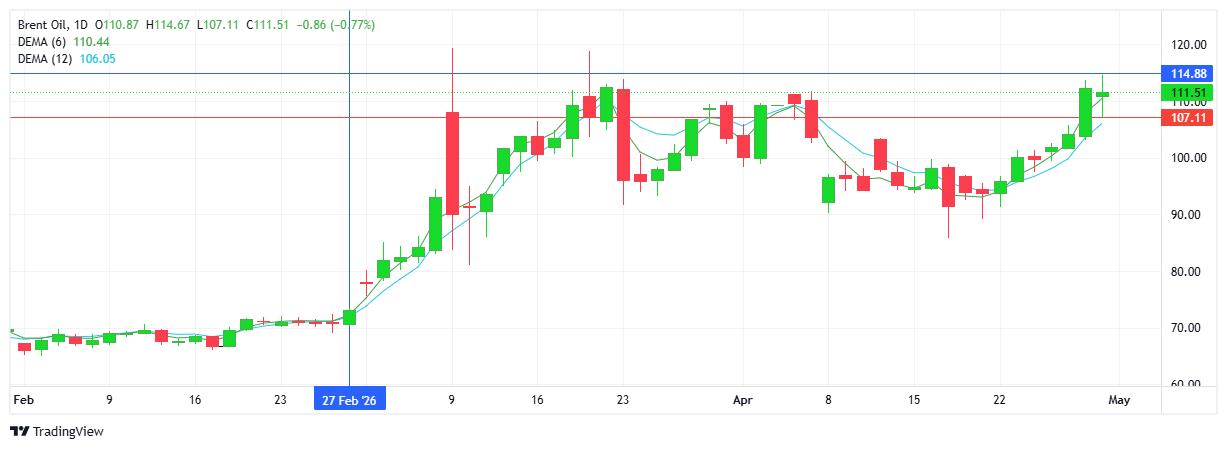
BRENT OIL
Brent oil sold off today in typical “oil market” fashion. Yesterday prices reflected a worst- case scenario - production and supply concerns with no off-ramp in sight; today no further escalation, in fact murmurs of a potential meeting between the waring parties, enough for prices to retreat. The doji-like candlestick confirms the unstable and uncertain situation. With $100 a long way down, the current $110 mark could become the new dividing line as the long-term supply concerns are becoming a reality. Resistance at $114.88 with support at $107.11.
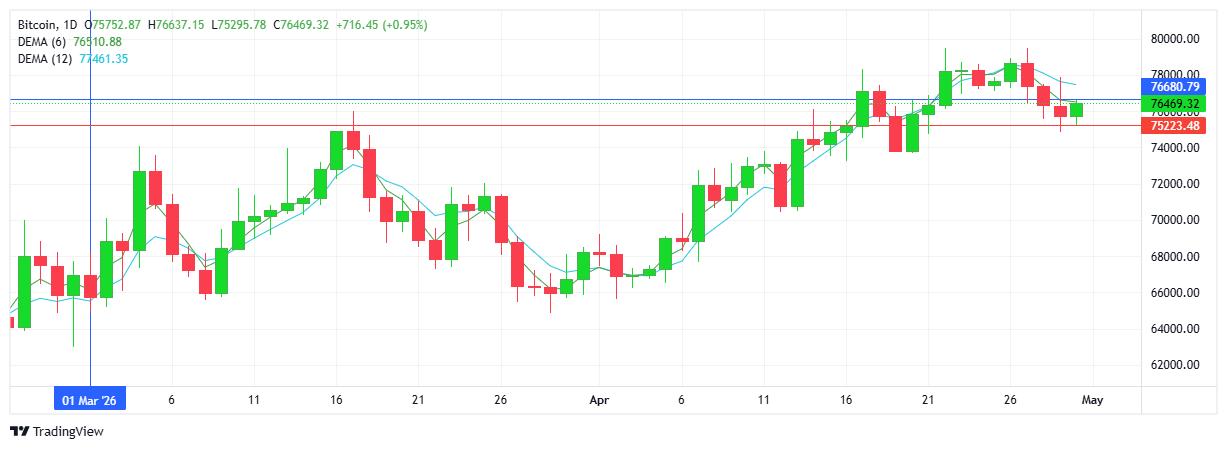
BITCOIN
Buyers won out on the day, with little change in the overall picture. Sellers aim below $75K and buyers look up above the $77K mark. Notwithstanding today’s green candlestick, the chart does reflect a lower high on the chart, with the downtrend remaining in place. Resistance at $76.6K with support at $75.2K.