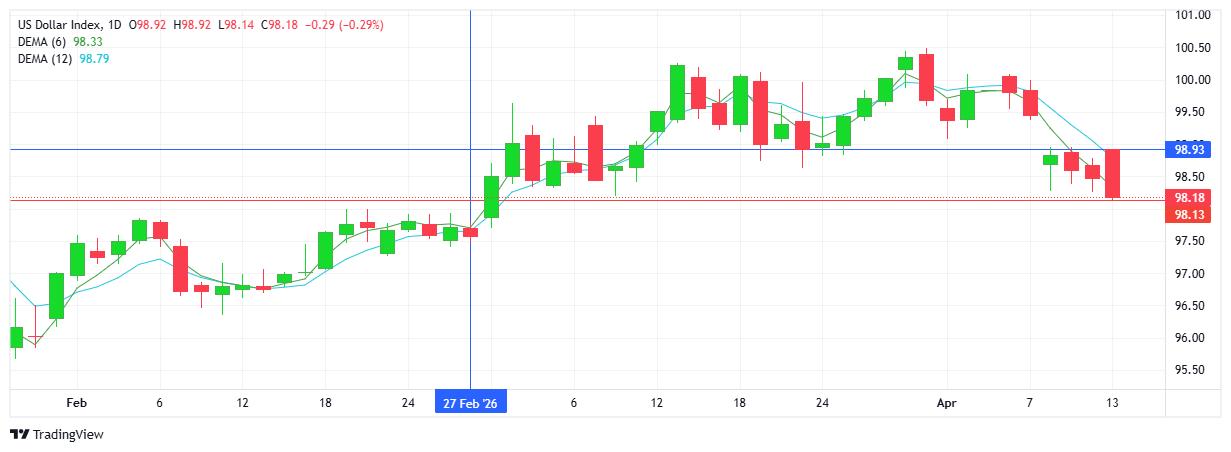
USD INDEX
Following a gap up to start the week, sellers controlled price activity with a gentle sell-off to start, picking up steam through the European and US sessions to close with a solid red candlestick. Note support matching lows from March and earlier this month. The risk-off theme saw USD sold across the board, ie. majors strengthened against the weak USD. Resistance at 98.93 with support at 98.30.
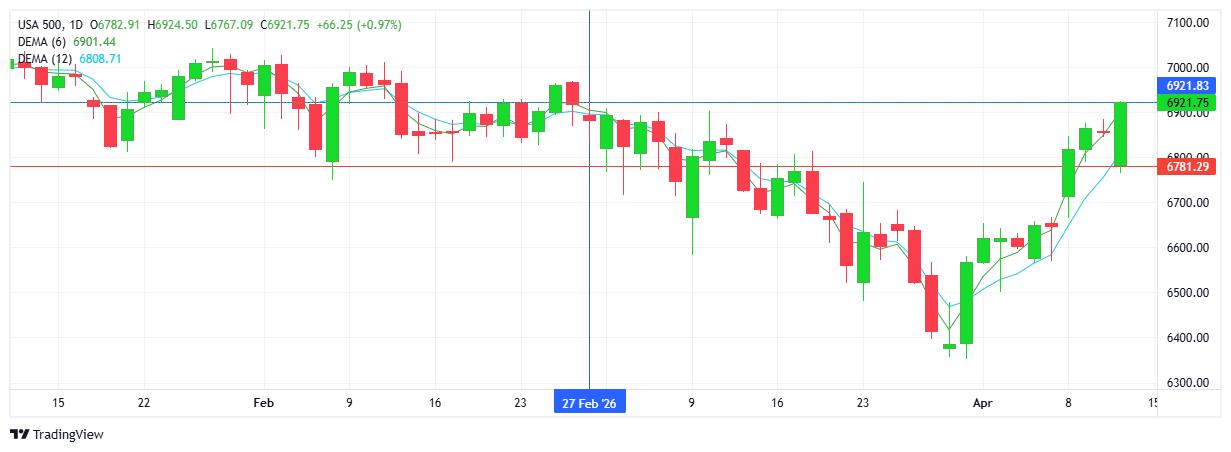
S&P 500
A gap down to start the new week was short lived as buyers confirmed demand for US equities as risk-on environment saw stock markets rally. The rally/uptrend which started at the beginning of the month has reached the level from where the index was sitting when the war started (Feb 27th). Next upside target at 6900. Strong inverse relationship playing out between weak USD and strong equities. Resistance at 6891 with support at 6781.
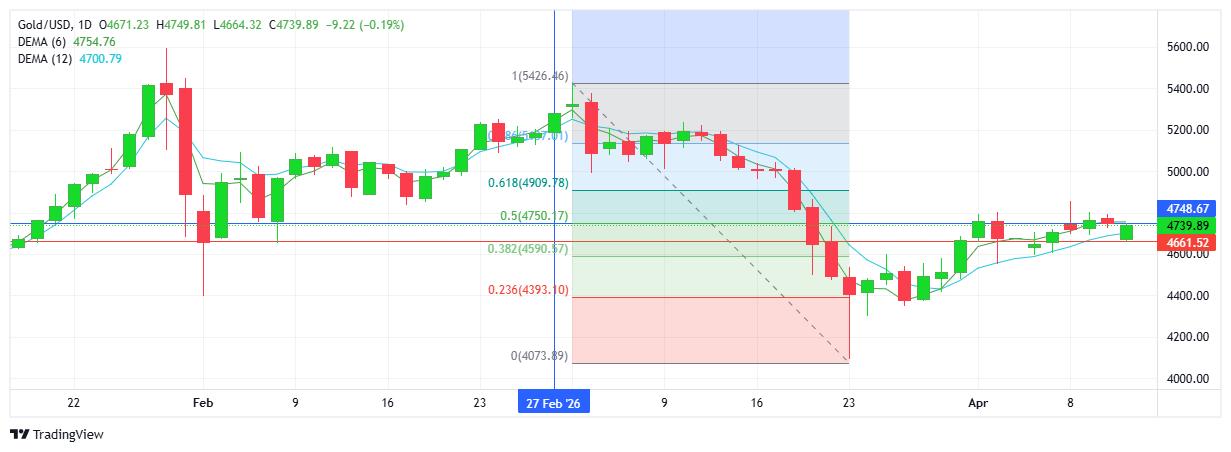
GOLD
Buyers stepped in at the open and continued adding gains with steady demand contributing to the uptrend which has been in place since the start of the month. However, today’s green candlestick reflects as a lower high and lower low on the daily chart, somewhat contradictory from a technical perspective. Note the fib retracement measuring the recent downtrend shows buyers currently held up at the 50% level - $4750. Resistance at $4748 with support at $4661.
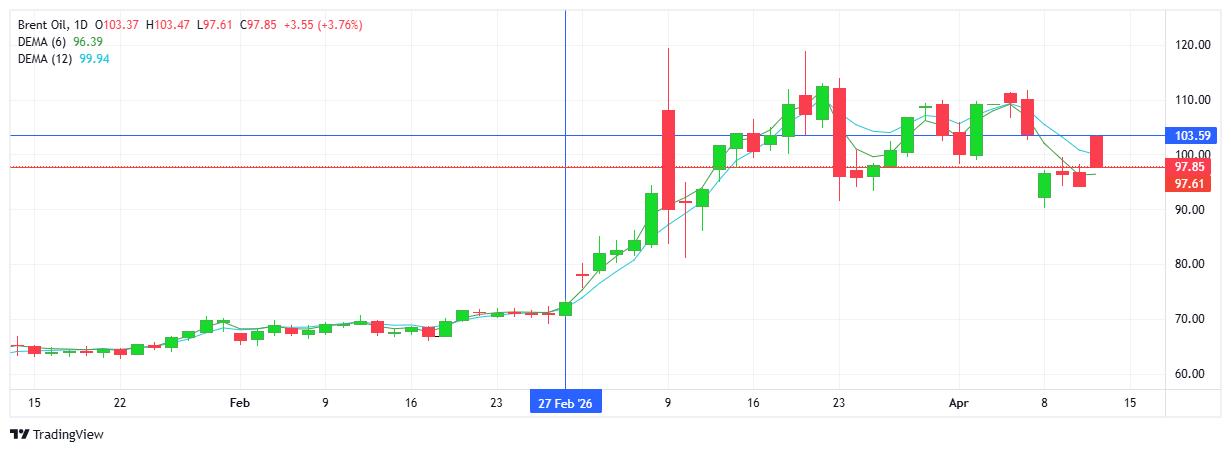
BRENT OIL
In a direct response to the failed peace talks in Pakistan, oil opened higher with a $9 gap up to start the new trading week, comfortably back above the $100 mark. Traders saw things differently and sellers took control with a steady push lower driving the price back to below the $100 level. A contradicting technical picture for sure, with the red daily candlestick adding to the downtrend, although the candles do reflect a higher high and higher low on the chart. Resistance at $103.59 with support at $97.61.
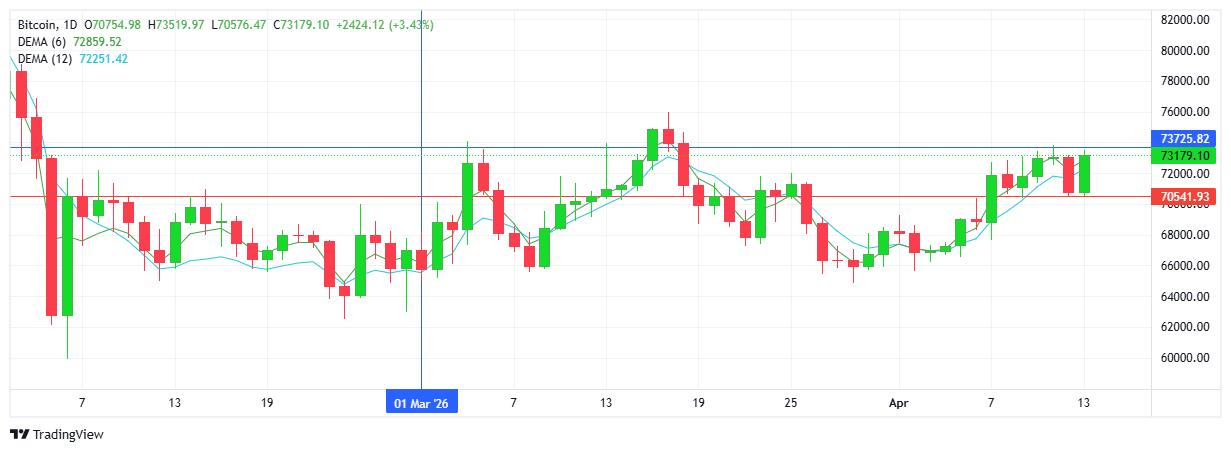
BITCOIN
Buyers recouped the weekend’s losses with price action remaining within the established $3K range between $70.5K and $73.5K. The trend remains up and bulls will note the highest close since March 16th. The next upside target sits at $76K. The current test of resistance is the 3rd attempt at these levels since March 2026. Note the support continues to be guarded by buyers and has held strong for the past week. Resistance at $73.7K with support at $70.5K.