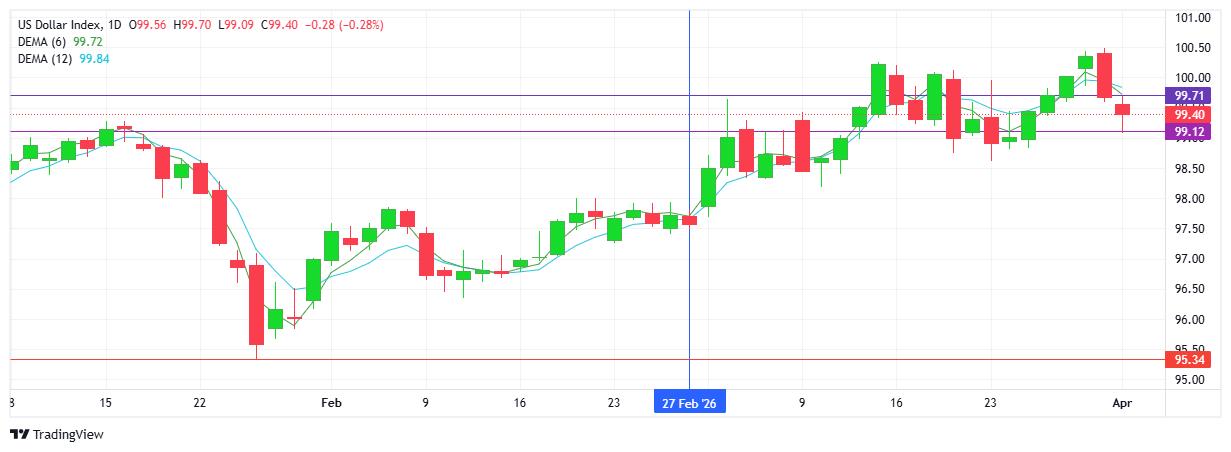
USD INDEX
Sellers added to yesterday’s sell-off as risk on theme continues with USD safe haven replaced by demand for equities and gold. Notwithstanding the late bounce/rally, the red candlestick confirms the downtrend with a lower high and lower low on the charts. For now, the 99.00 support area being guarded by buyers. Resistance at 99.71 with support at 99.12.
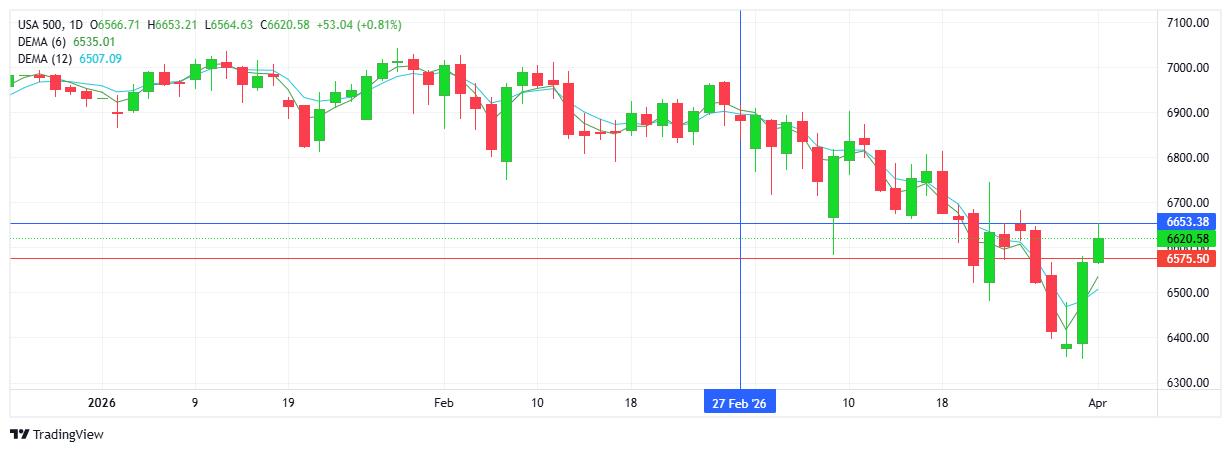
S&P 500
Equity markets followed up on yesterday’s rally in response to the positive news regarding a de-escalation in the middle east conflict. Steady demand saw the index adding to the strong bounce/reversal with buyers in control. Next upside target sits at 6700. Resistance at 6653 with support at 6575.
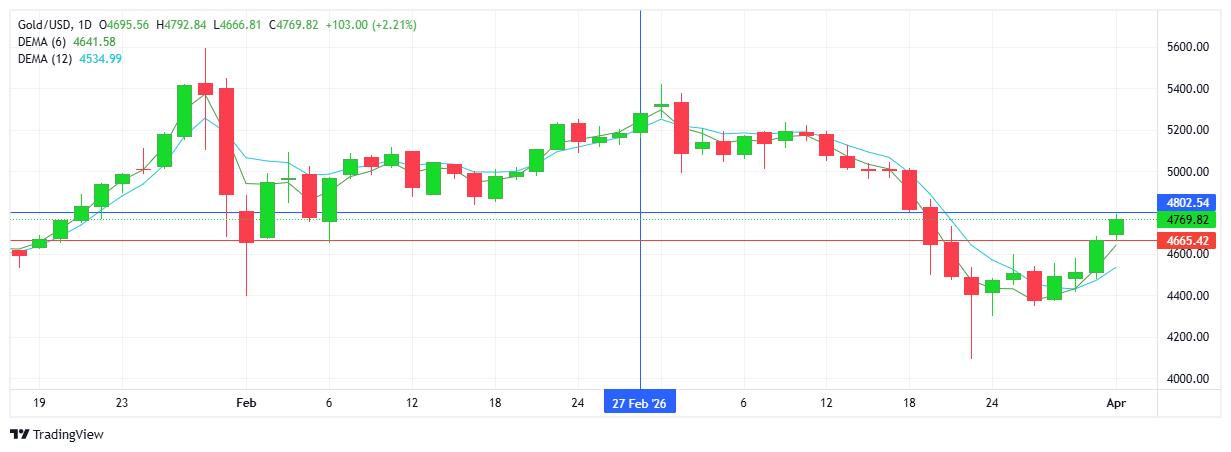
GOLD
The metal added to yesterday’s gains with a 4th consecutive higher high and higher low on the charts. Noteworthy that although gold’s safe haven status was never in question, it took the current USD sell-off to trigger renewed demand. Today saw $4800 tested on the upside with trend, bias and sentiment all favouring the move higher. Resistance at $4802 with support at $4665.
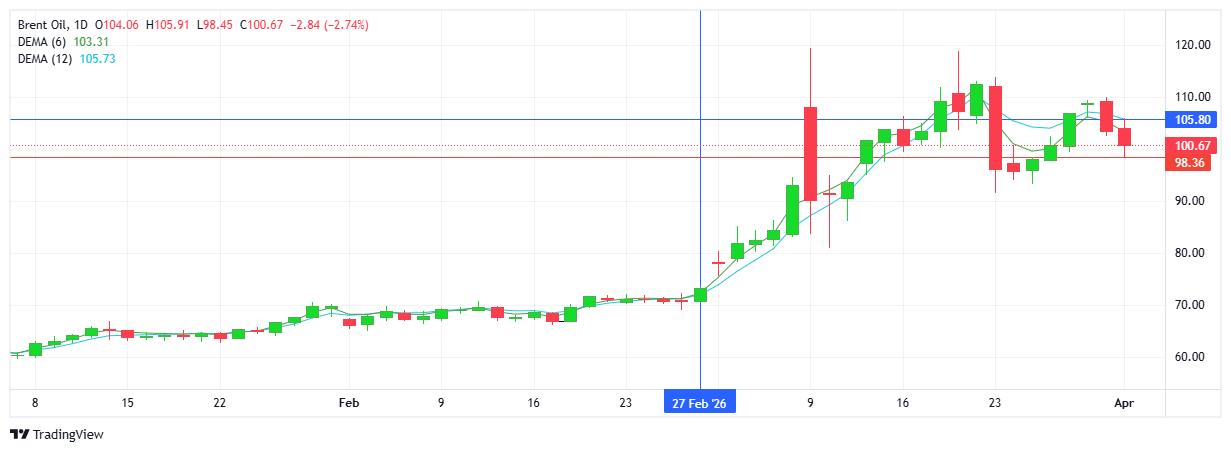
BRENT OIL
Technically yesterday’s bearish engulfing candlestick saw the reversal play out today as sellers added to the new downtrend. Price action tested the pivotal $100 level, although buyers did manage to protect the area, for now. Continued optimism re. a settlement or ceasefire between US and Iran is the main contributor. However, it is worth noting that the optimistic tone and positive announcements come from the US, with Iran questioning the imminent “declaration of peace”. The straits of Hormuz remain closed. Resistance at $105.80 with support at $98.36.
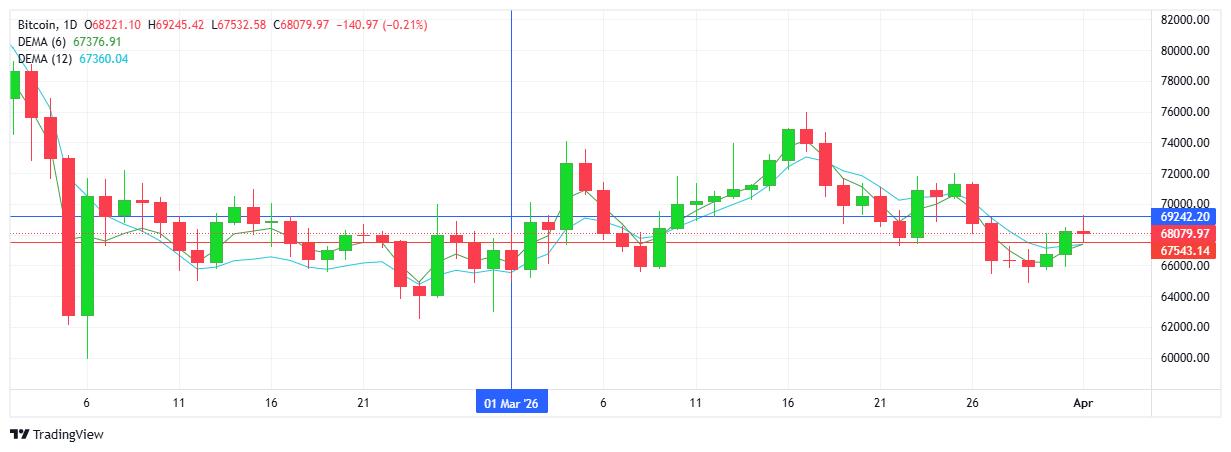
BITCOIN
A doji-like candlestick, a close price alongside that of yesterday, and buyers held up at the $68K mark. A new day, but not much has changed. Buyers can look at a higher high and higher low on the chart, while sellers confirm the lack of demand at current levels. Resistance at $69.2 K with support at $67.5K.