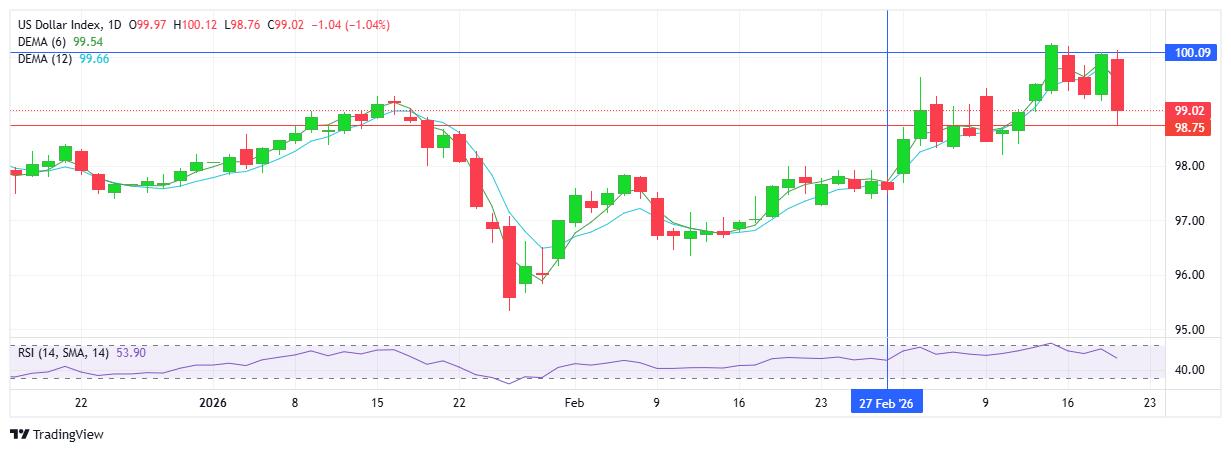
USD INDEX
Yesterday’s USD rally came to an abrupt end today as the world’s reserve currency took a beating on all fronts. Sellers were relentless as the index bounced down off the 100.00 resistance area with buyers offering no reprieve. Limited demand continued until a brief bout of buying late in the US session. The 99.00 level barely holding as the day comes to a close. Resistance at 100.09 with support at 98.75.
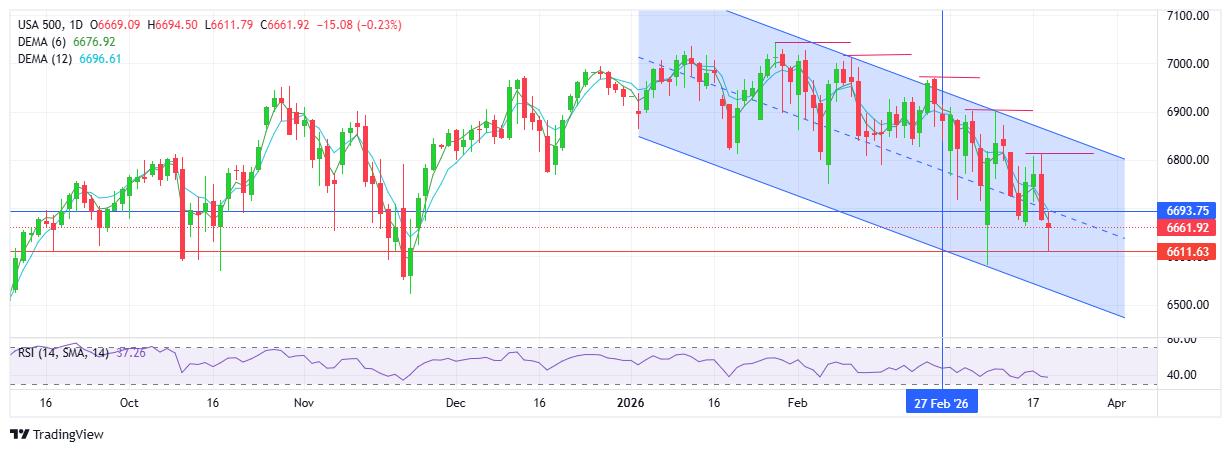
S&P 500
Although sellers won out on the day, adding to the downtrend, buyers did put in a late rally and recouping most of the day’s losses. Note the 6600 support area managed to hold and provide a springboard for the late bounce. Overall, the day’s activity saw both the USD and equities being sold off, rather than the typical inverse relationship between the 2 major indices. Resistance at 6693 with support at 6611.
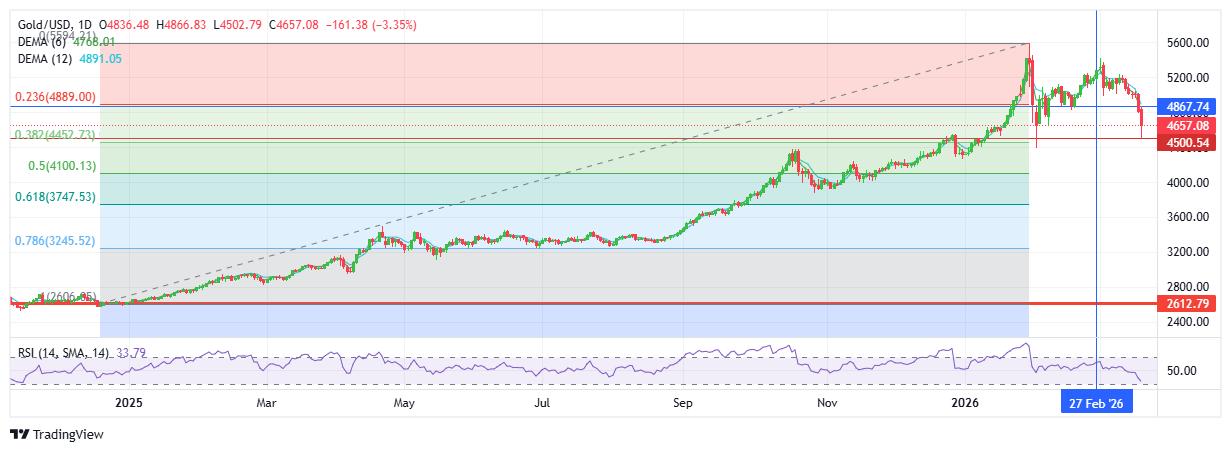
GOLD
The sell-off started early as the metal recorded a 7th consecutive day of losses, with the move measuring a $300+ slide lower at it’s most extreme. Buyers did step in through the afternoon US session, recouping over $150 to close within the $4650 area. Note the fib retracement tool measuring the rally which started in 2025 ($2600) up to the Feb 2026 high ($5600) - the first 38.2% downside target sits at $4452 - perhaps a technical level for buyers to return? RSI at 33 confirming oversold conditions. Further, what of the inverse relationship between weak USD and strong gold? Resistance at $4867 with support at $4500.
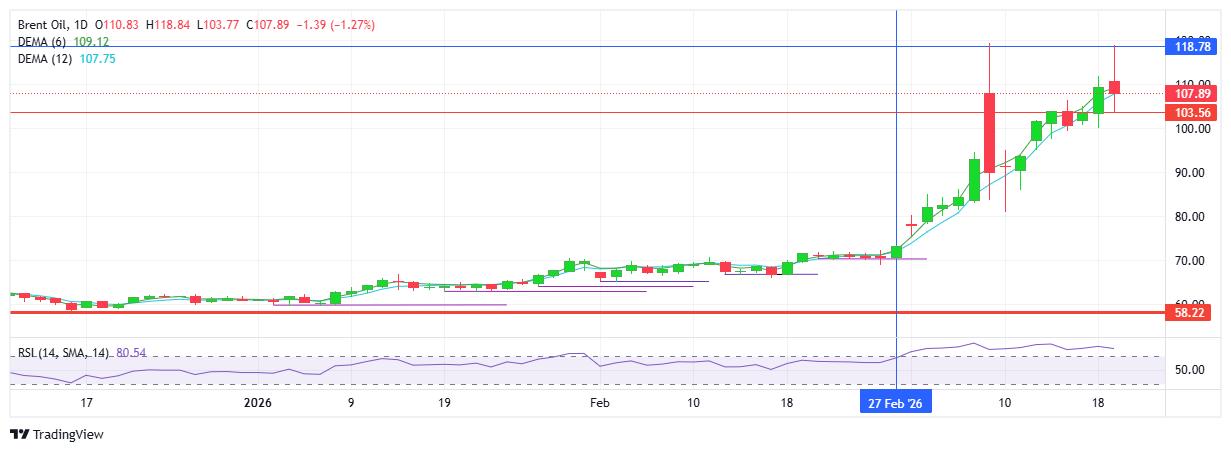
BRENT OIL
Today saw the oil market at it’s most volatile as prices whipped sharply within a wide $15 range. The contradictions: sellers won out on the day with a red candlestick reflecting a $3 overall loss between open and close. The daily candlestick reflects a higher high and higher low on the chart. The $118.80 resistance matched that from March 9th. And clearly the uptrend remains firmly intact. Fundamentally, Israel’s attacks on Iran’s infrastructure - military, oil supplies - picked up steam; Iran maintains control of oil supply routes; US unable to secure international support. Resistance at $118.78 with support at $103.56.
BITCOIN
The lack of activity in the cryptocurrency begs the question: why no interest in BTC as the entire financial world is scrambling? The mini rally from last week has been erased as prices return to the pivotal $70K area. Today marks the 3rd consecutive red candlestick and was enough to reignite the downtrend. RSI sits at 50 with no preference in either direction. Should buyers attract demand and retest current resistance, today’s low may be viewed as a higher low on the daily chart. Resistance at $71.7K with support at $68.7K.
