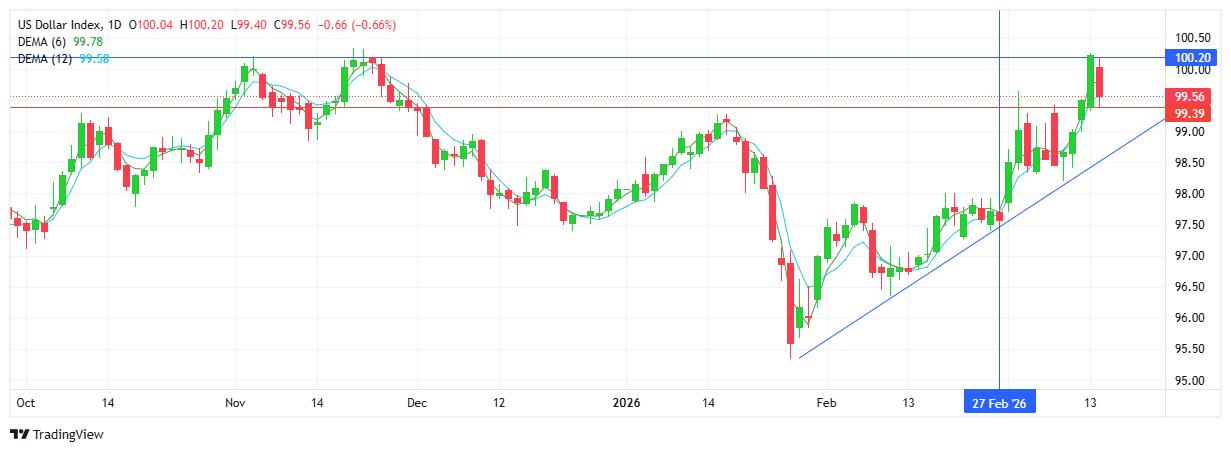
USD INDEX
The start of the week sees a different picture with the USD being sold off across the board, in sharp contrast to last week’s strong rally. The initial reaction to the middle east conflict saw a flight to dollars as the safe asset/currency. As the war enters it’s 3rd week will global markets move gears from panic and fear, to acceptance and normalization? Technically the 100.00 mark has again proved to be a level guarded by sellers. Resistance at 100.20 with support at 99.39.
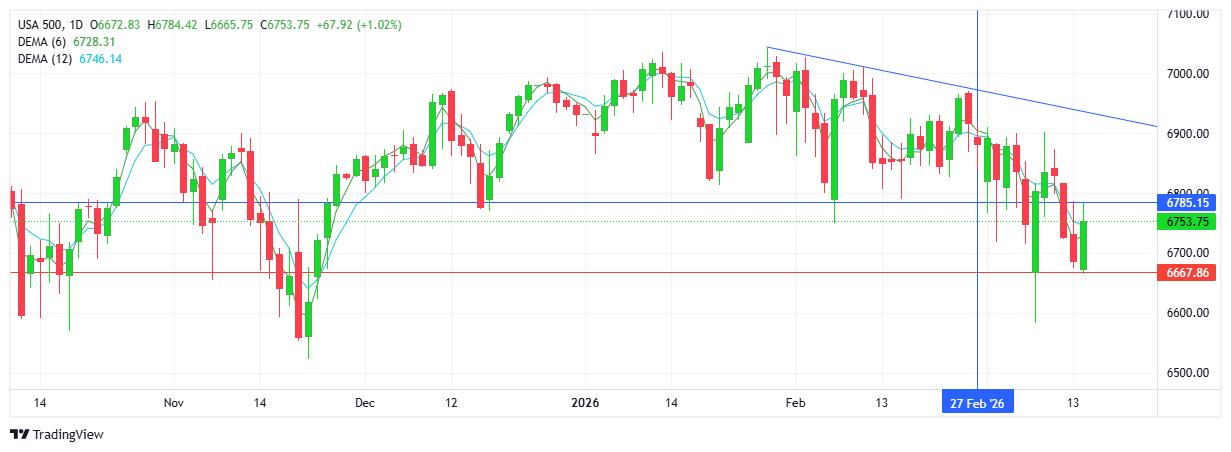
S&P 500
Following a gap down to start the week (futures market), buyers stepped in and erased Friday’s losses with a solid green daily candlestick. Today’s bounce up confirmed the traditional inverse relationship between weak USD and strong equities. Note the strong 6700 support area protected by buyers. Notwithstanding today’s move higher, the downtrend remains intact. Resistance at 6785 with support at 6698.
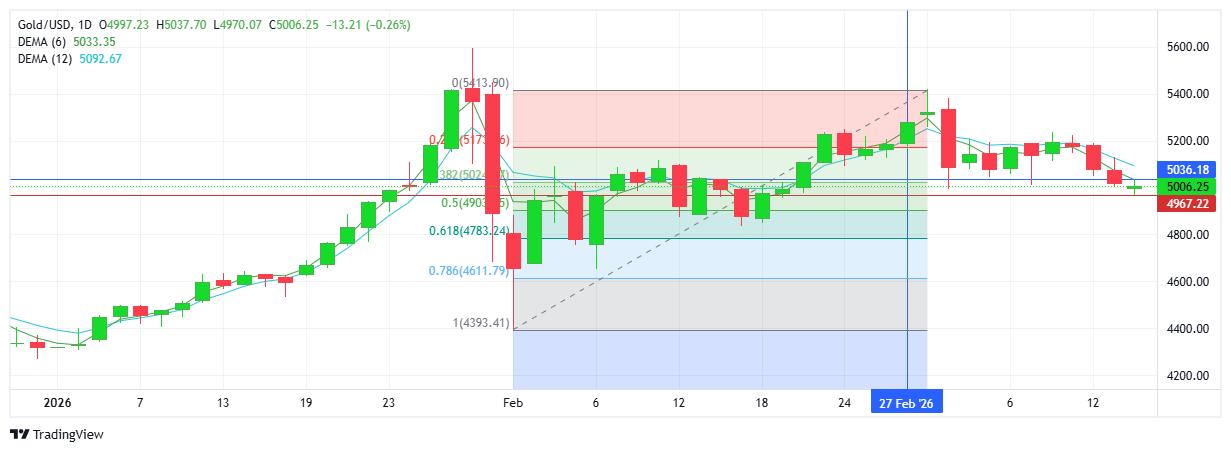
GOLD
Buyers did enough to break a 3-day losing streak with a higher close (green candlestick) and managed to regain the $5000 level. Just how bullish today’s move actually looks from a technical perspective: the downtrend extends with a lower high and lower low on the chart. Even the sharp USD sell-off was not enough to initiate a meaningful reversal as the safe have commodity continues to attract little demand. Note the fib retracement from $4392 up to $5418 - the retracement has broken below the 38.2% ($5024) and next downside target at 50% sits at $4903. Resistance at $5036 with support at $4967.
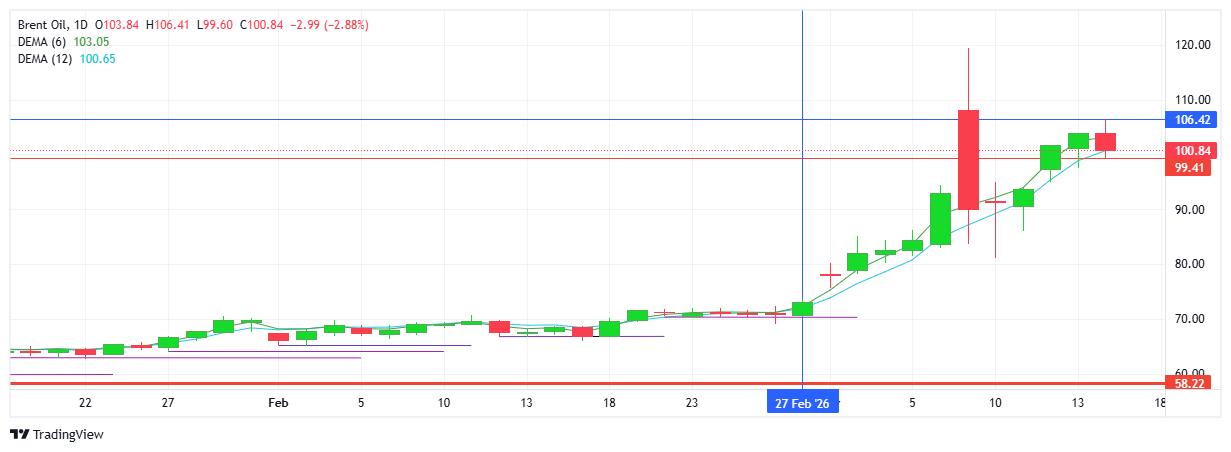
BRENT OIL
As is the behaviour regarding the oil market, extreme moves are in anticipation of supply concerns with a worst-case scenario priced in to the volatility. The far off $100 price now sits as the new norm, or comfort level as prices hover around the pivotal number. Although sellers won out on the day, the chart does reflect a higher high and higher low. It does appear that Iran is controlling the tempo for now with the US seeking help from NATO and other global powers (S.Korea, Japan, China) to join the US/Israel alliance in an attempt to re-open shipping routes from the region. With fundamentals driving prices for now, it seems technical levels are less relevant regarding price levels. Resistance at $106.42 with support at $99.41
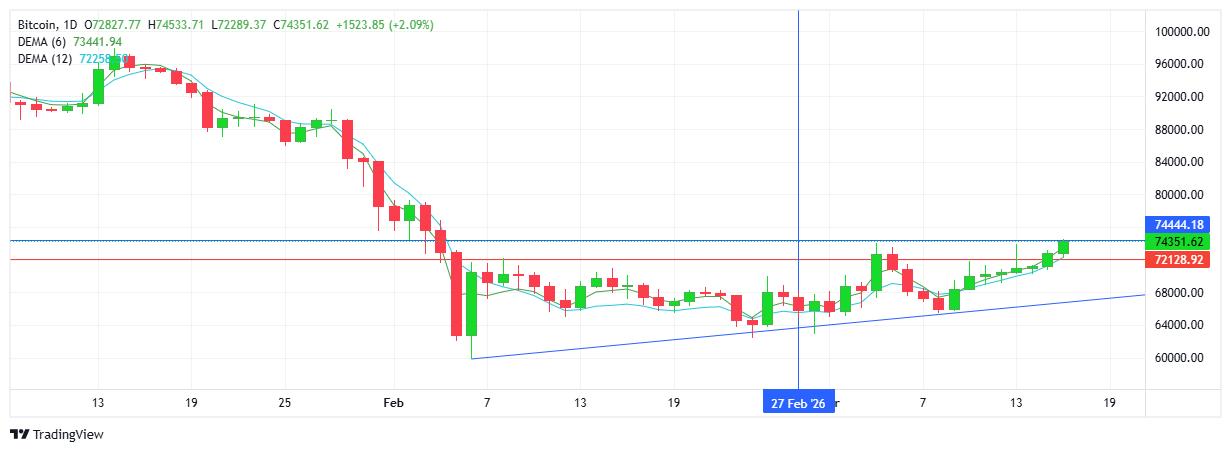
BITCOIN
Perhaps surprisingly, maybe not, BTC continues its slow but steady climb higher as buyers add to the recent succession of higher highs and higher lows on the chart. Noticeably the previous resistance area ($72K) has been cleared as demand for the cryptocurrency outweighs supply going into the new week. Interesting that BTC has displayed resilience, although limited, through the first 2 weeks of the middle east conflict - something we have not yet seen from the traditional safe haven commodity, namely gold. Buyers will aim for the $80K as the next meaningful upside target, while sellers look below $70K to re-establish the downtrend. Resistance at $74.4K with support at $72.1K.