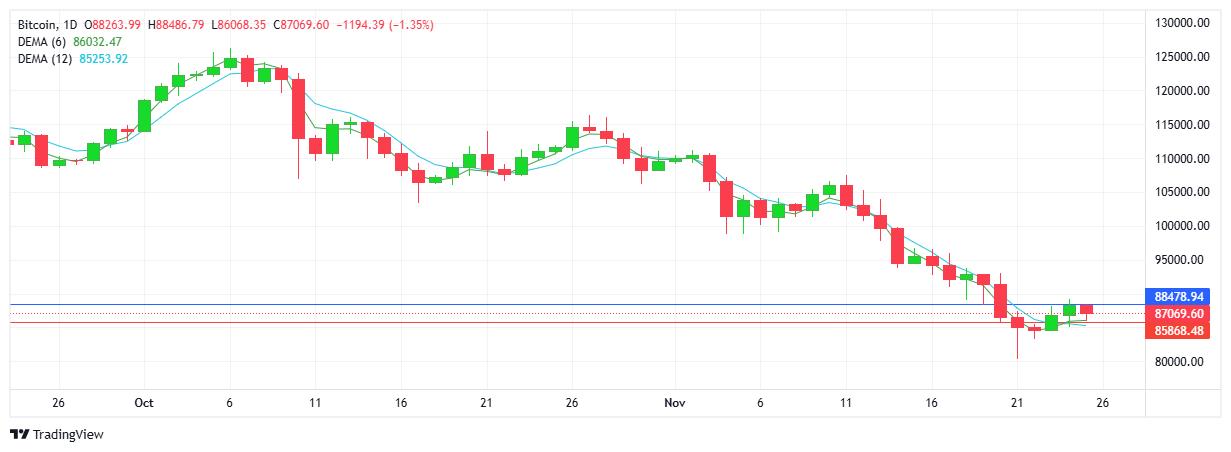
USD INDEX
The move higher from last week has been reversed as sellers added to yesterday’s pause, going on to establish a new downtrend on the charts. In context we can see the index continues to trade at the high end of market activity since the middle of the year. Buyers will aim to reclaim the 100.00 level while sellers look below 99.00. The dollar seems to be trading in an “uncertain mood” as the markets wait on December’s Fed rate announcement. Resistance at 100.20 with support at 99.55.
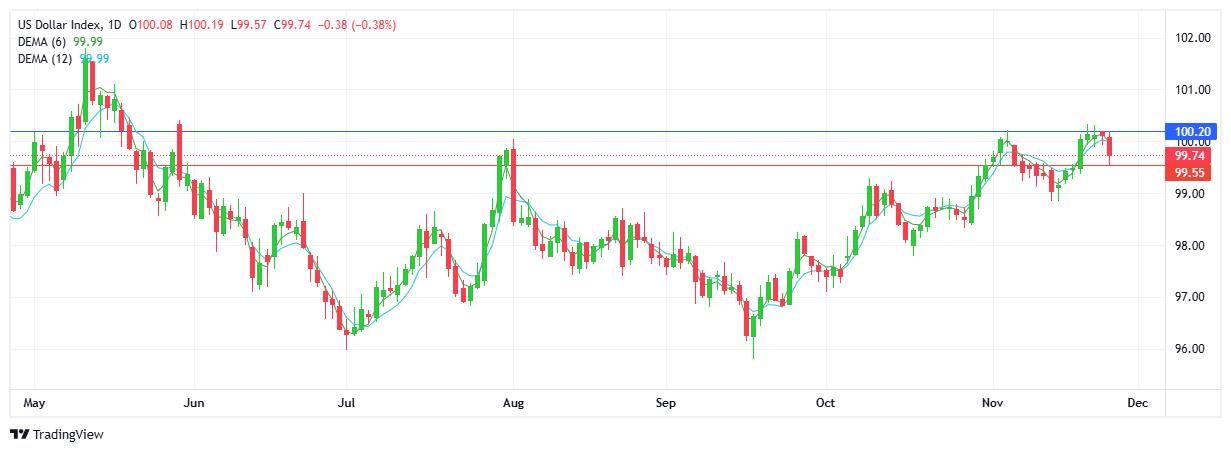
S&P 500
Today saw the classic inverse relationship play out with the stock markets rallying as the USD was sold-off. The strong push higher was enough to confirm the uptrend (EMAs crossing up) with the 3rd consecutive higher high and higher low on the chart. Buyers will be looking to break above 9800, while sellers look back at 6700 in an attempt to resume last week’s downtrend. Resistance at 6790 with support at 6674.
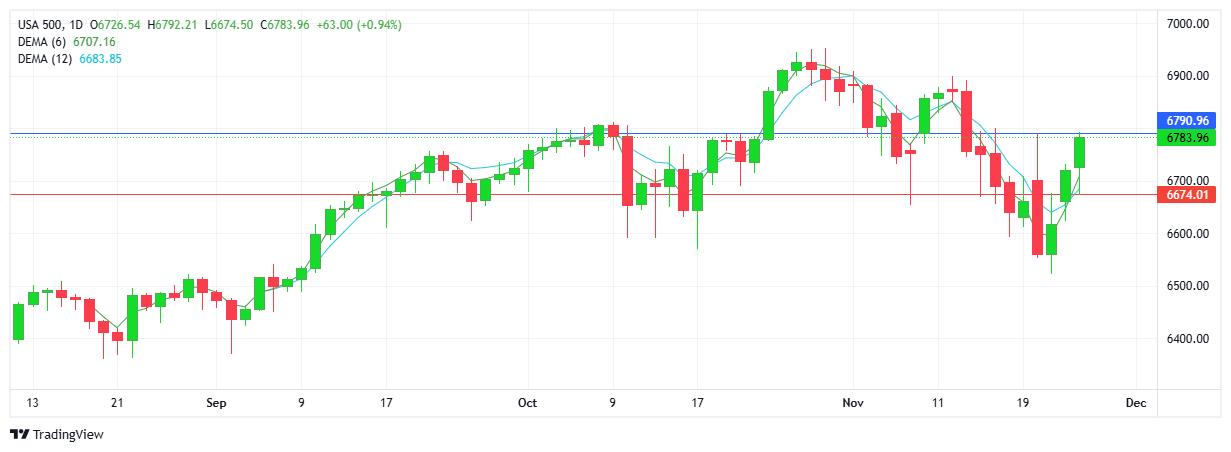
GOLD
Buyers and sellers traded punches with neither side able to make a meaningful move. The doji-like candlestick confirms the indecision, with the close matching that of yesterday. While the newly formed uptrend remains intact, note that the descending trendline held strong. The metal continues to retain it’s safe-haven status, as traders appear content to take a break within the bullish environment. (above $4000 = bullish?) Resistance at $4155 with support at $4109.
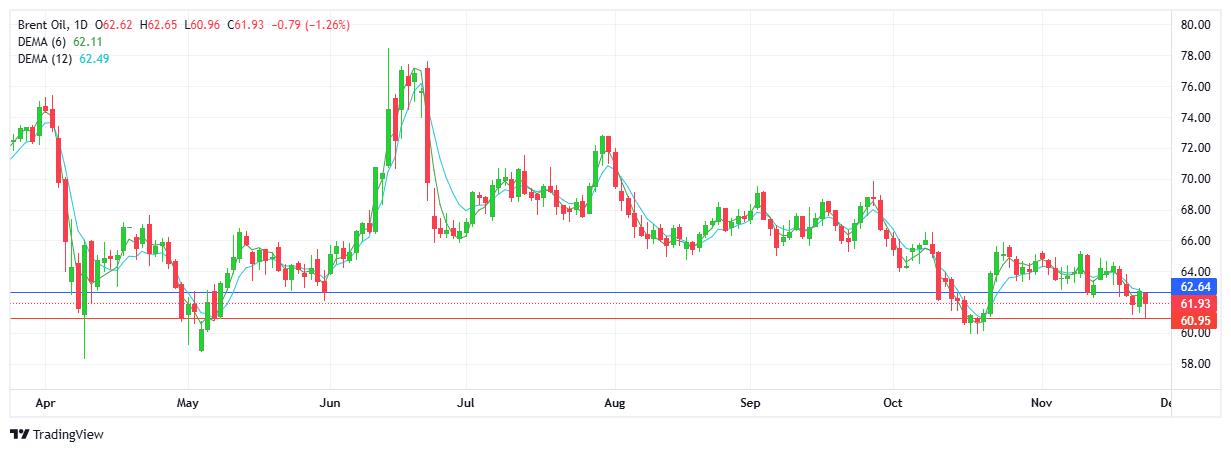
BRENT OIL
Buyers responded to the early sell-off and went on to recoup half of the day’s losses through the US session. The trend remains down, and the charts reflect a lower high and lower low confirming the downward bias. Note price activity trading a leg lower between $61 and $63. The $60-$61 support area has been guarded by buyers all through the year. Monthly, weekly and daily charts all currently in a downtrend (EMAs crossed down). Resistance at $62.64 with support at $60.95
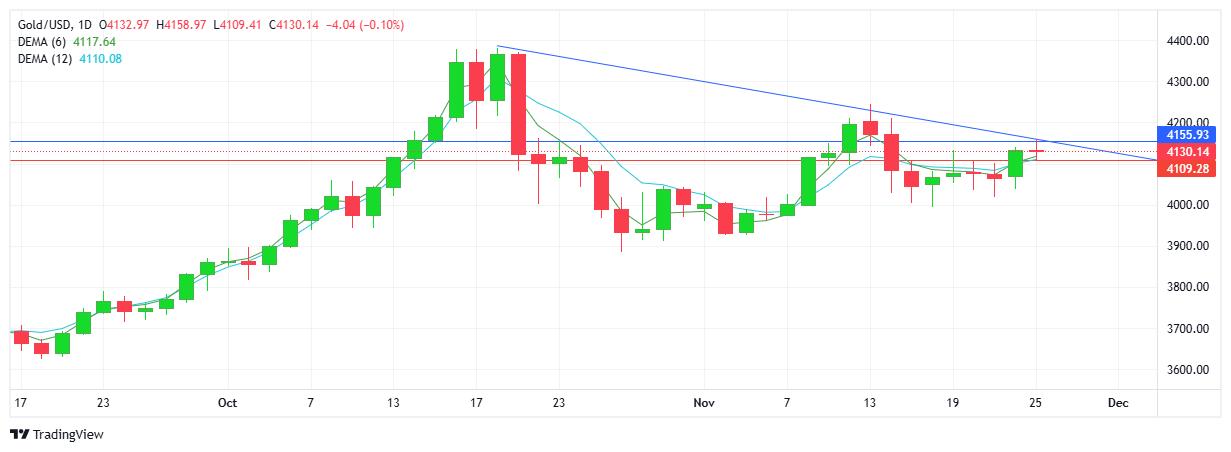
BITCOIN
Buyers were not able to add to the brief 2-day bounce as sellers halted the move higher. Note buyers did step in early which reflects as a higher low on the chart. Buyers will aim above $89K in an attempt to add to the uptrend, while sellers will look below to the $85K-$86K area to re-establish the downtrend. Resistance at $88.4K with support at $85.8K.