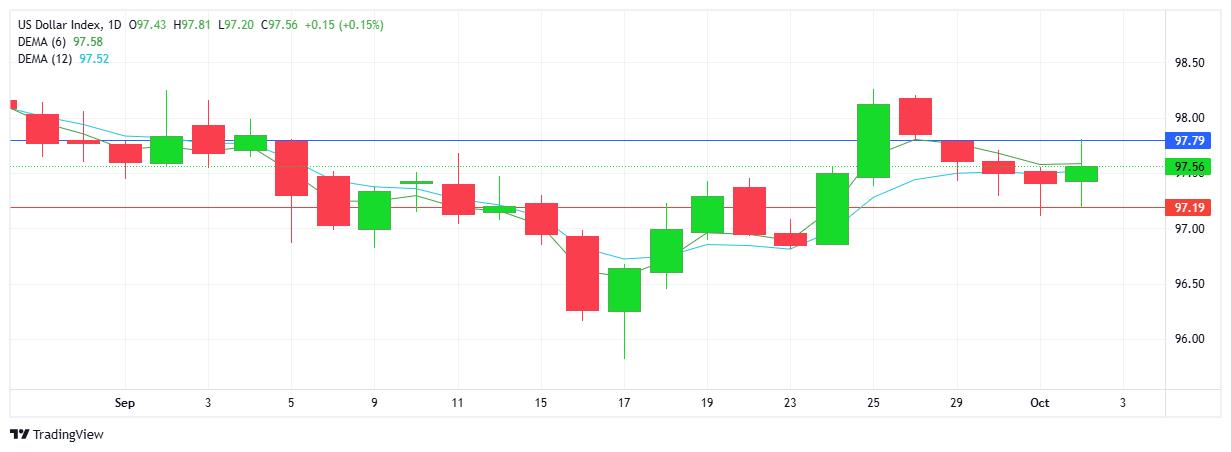
USD INDEX
Buyers stepped in today and halted the 4 day sell-off doing enough to technically end the downtrend. Although the EMAs now confirm the leading indicator is above the lagging indicator, practically price activity looks like its moving sideways. Resistance at 97.79 with support at 97.19.
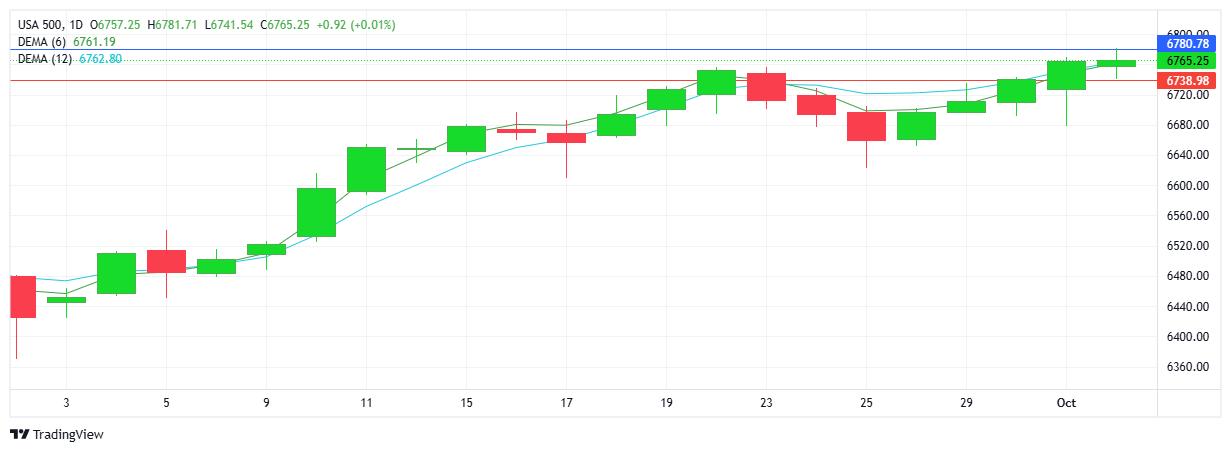
S&P 500
A gap lower to start, followed by a gentle push higher was enough for the index to set yet another record high on the day. Demand for US equities was seen across the board. Note today’s close alongside that of yesterday. Resistance at 6780 with support at 6738.
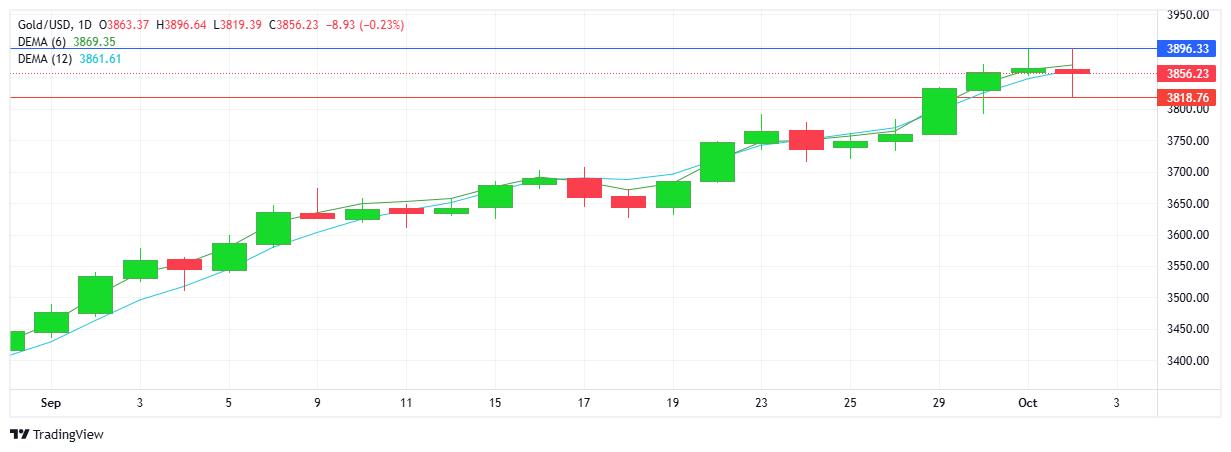
GOLD
Buyers were off to an early start before sellers put in a sharp push lower, (profit-taking) only for buyers to step back in and end the day right alongside yesterday’s close. The indecision was confirmed by a doji-like candlestick. Note the double top which is a strong reversal signal. Technically today’s candle could be classified as a bearish engulfing candlestick, although the body is very tight. Resistance at $3896 with support at $3818.
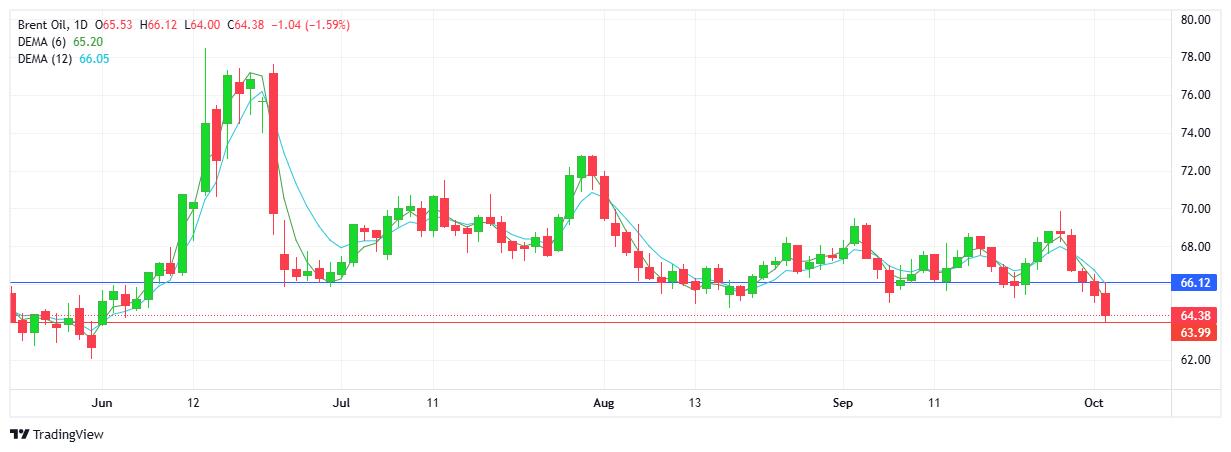
BRENT OIL
The 4th consecutive day of lower highs and lower lows added to the strong downtrend. Significantly sellers broke, and maintained below the tough $65 support area. Continued lack of demand could see sellers now aiming at $62, (May 30th 2025) the next support level. Resistance at $66.12 with support established at $64.
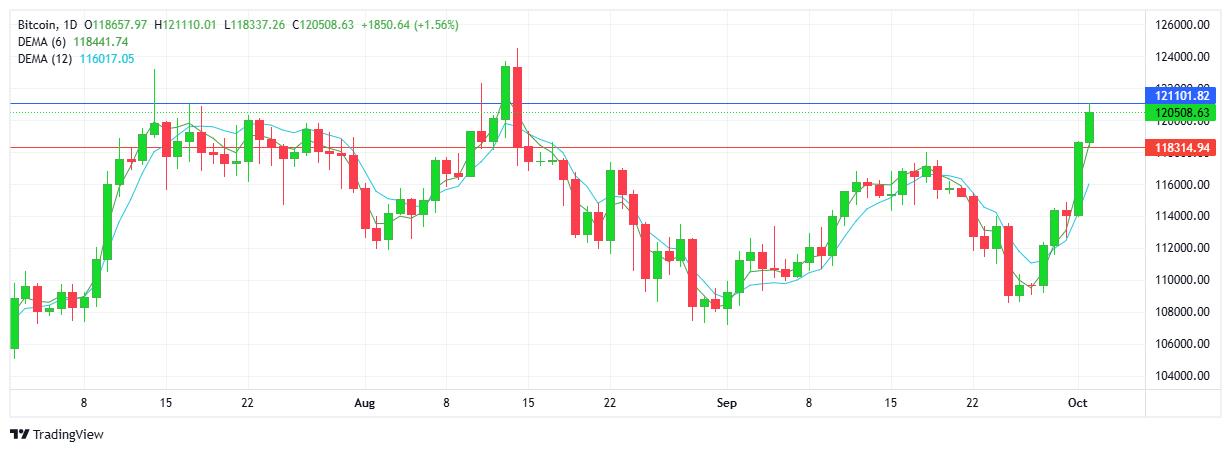
BITCOIN
Buyers in total control as the demand for the cryptocurrency continued with sellers continuing to stand on the sidelines. The $13K rally ($108K - $121K) resembles the run we saw earlier this year (July 9th 2025). Buyers will be targeting the record high $124K (August 14th 2025). Resistance at $121.1K with support at $118.3K. Fundamentally bitcoin is perhaps showing signs of an alternative, or secondary safe haven asset as it plays catch up with gold’s historic run.