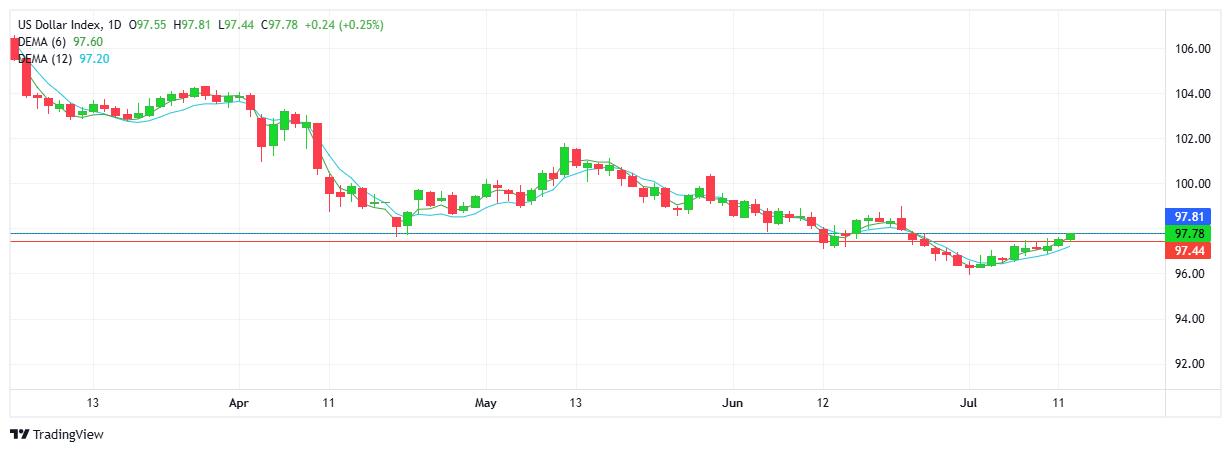
USD INDEX
Buyers picked up from last week confirming demand for the global currency. Higher highs and higher lows add to the uptrend. Resistance set at 97.81 with support lower at 97.44. Note USD and equity markets moving higher together.
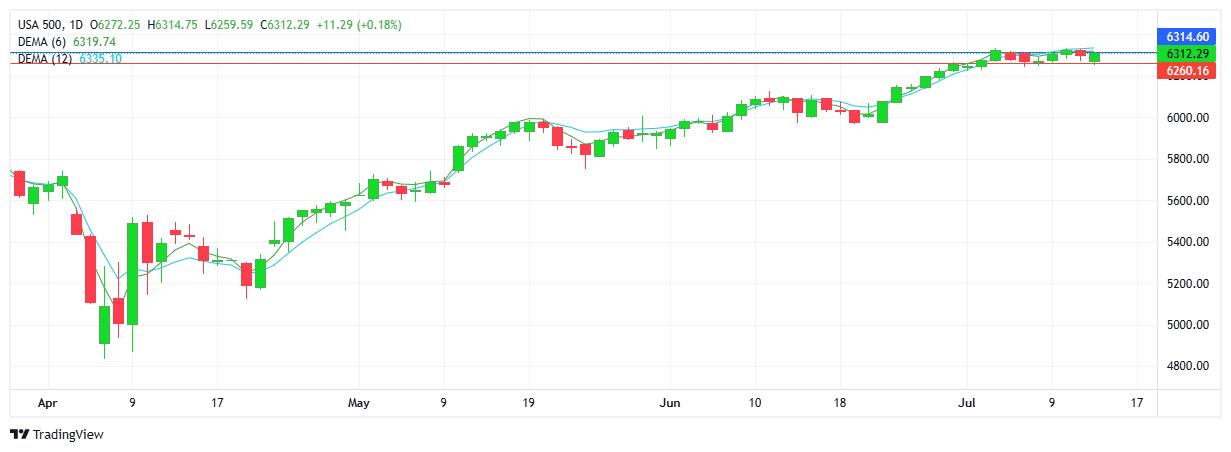
S&P 500
A gap lower to start the week, followed by buyers stepping in and erasing the losses. The trend remains sideways with price action loosely contained between 6200 and 6300. Support was set at 6260 with resistance established at 6312. EMAs continue to move alongside each other with neither indicator taking the lead. Interesting that Trumps tariff deals seem to have little effect on demand within the major US stock markets.
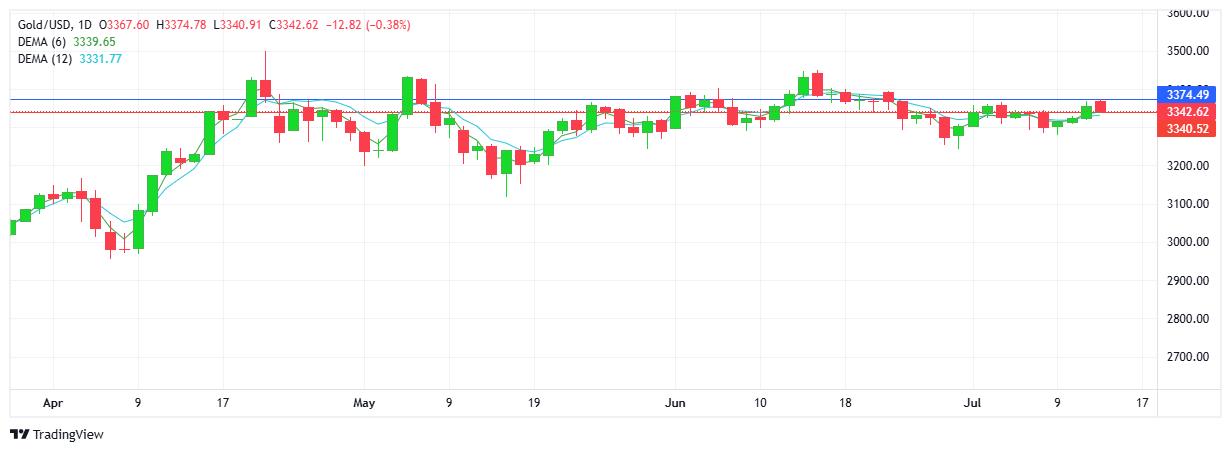
GOLD
A gap higher to start the week, with limited follow through as sellers controlled the day’s activity. While the uptrend remains intact, the contradictory technical indicators show a red daily candlestick - together with higher highs and higher lows - adding to the established uptrend on the daily chart. While gold’s safe haven status is not under question, clearly there is a lack of demand above the $3350 mark. Resistance sits at $3374 with support holding at $3340.
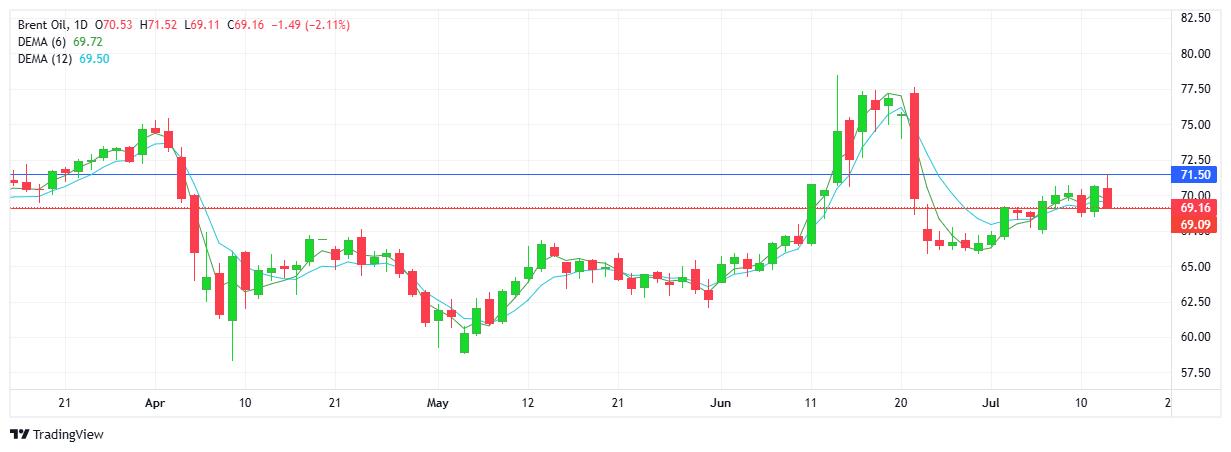
BRENT OIL
Following a brief push higher at the start, sellers took control and went on to give up the early gains and close lower on the day. The technical contradiction shows a higher high and higher low on the daily chart, in spite of the trend reversing to the downside. Resistance was set at $71.50 with support established at $69.09. The trend lacks direction with neither buyers (above $71) or sellers (below $69) able to add to intraday moves.
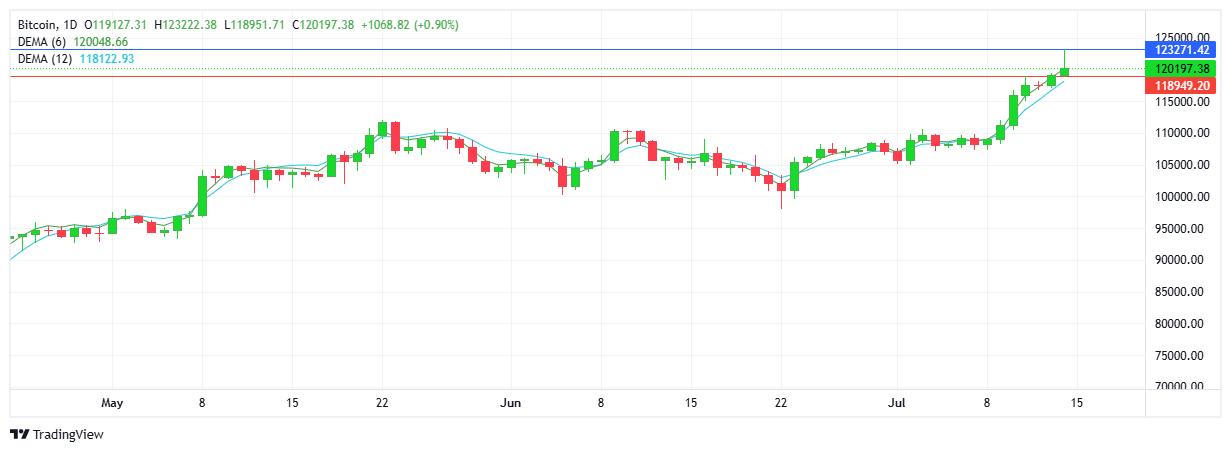
BITCOIN
Buyers started the new week with an early rally adding to weekend gains. Resistance was established at a new record high $123.2K, before sellers stepped in and wiped out the days push higher, going on to close at $120K. Support sits at $118.9K. The retracement on the shorter time frames has not affected the strong uptrend on the daily chart.