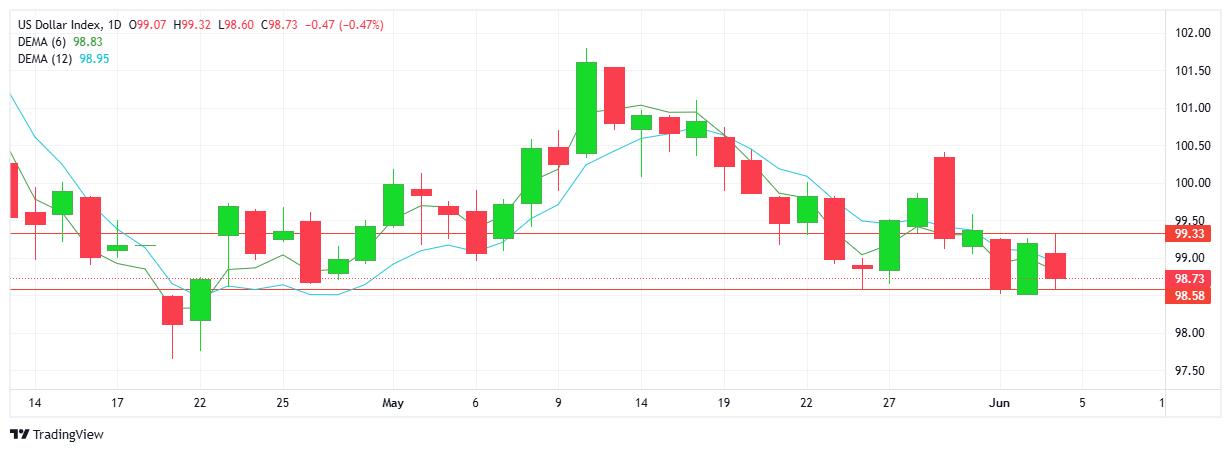
USD INDEX
Sellers controlled the days activities with resistance established at 99.33 and support set below at 98.58. The technical picture is contradictory with todays candle reflecting a higher low and higher high within the ongoing downtrend. While buyers and sellers have not been able to extend daily moves the sentiment surrounding the USD remains negative, in spite of data reports confirming the US economy is in good standing. Note the solid support for the 3rd consecutive day.
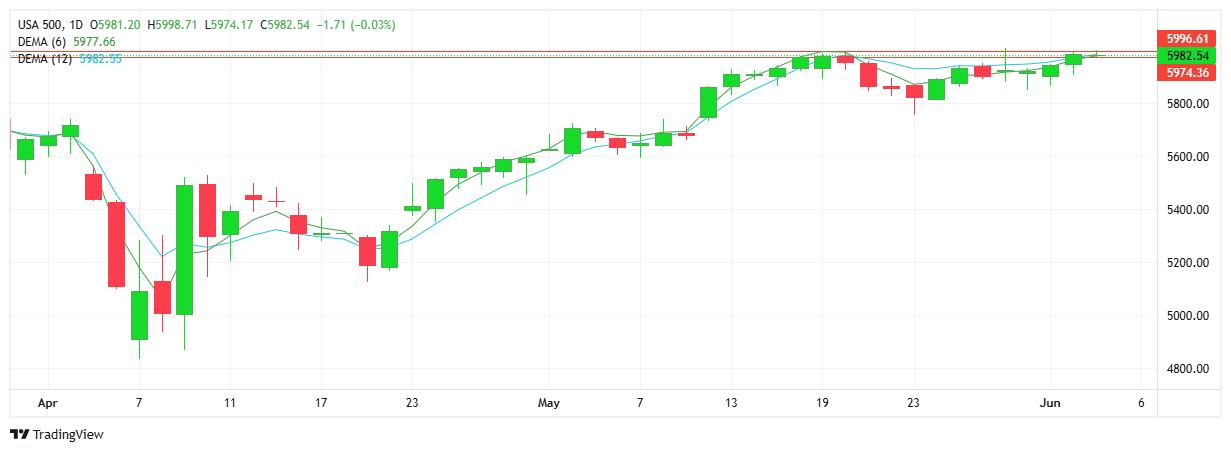
S&P 500
The net result today shows a close matching yesterdays level with a doji-like candlestick confirming the lack of direction. The slight push higher was enough to produce a 4th consecutive green candle with higher highs and higher lows gently adding to the uptrend. Resistance sits at 5996 with support sitting slightly below at 5974. Note the resistance level gave way to supply/sellers last month(May).
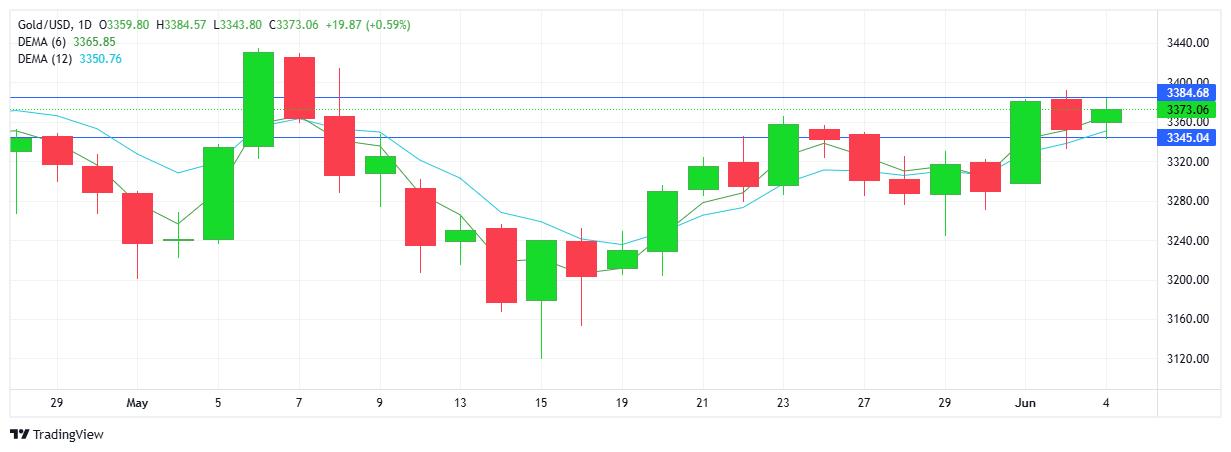
GOLD
A gap lower to start the day was followed up by buyers winning out and showing a slight gain from the open. Resistance established at $3384 with support at $3345. Note the higher low on the charts and todays activity adding to the uptrend. The resistance area has held strong for the past 3 days. The bias remains up as golds safe haven status continues to attract buyers at all levels. Sentiment favours further upside with retracements and pull-backs appearing to be technical in nature.
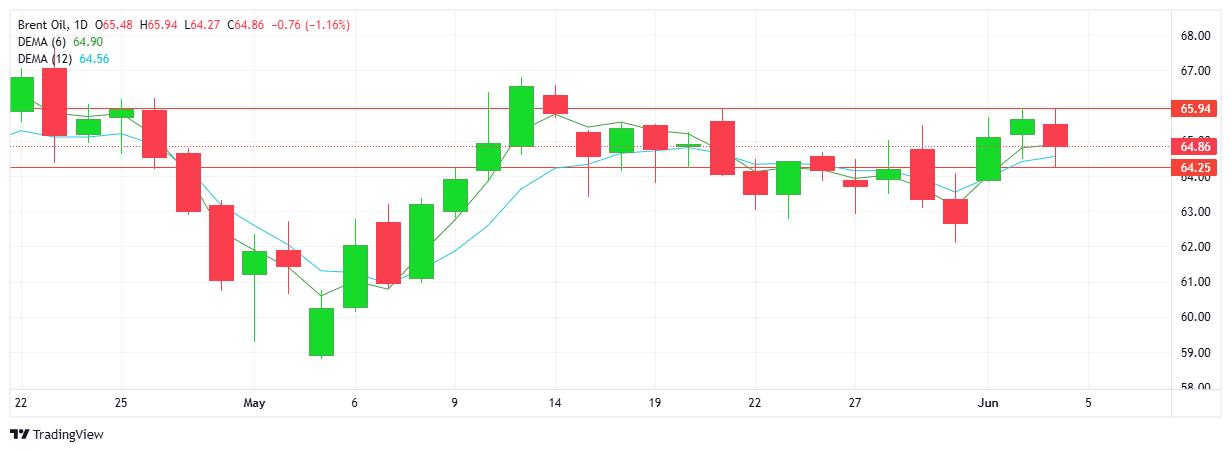
BRENT OIL
A mixed day as price activity in both directions resulted in sellers winning out and a red daily candlestick. Note todays move down remains within the daily uptrend. Buyers will aim to break above $66 while sellers aim to break below $64. Taking a step back and looking at the big picture, the sideways trend continues with neither buyers or sellers able to maintain a meaningful trend in either direction. See the double-top formation which is a reversal sign. Buyers can see the $62 low (May 30) as a higher low.
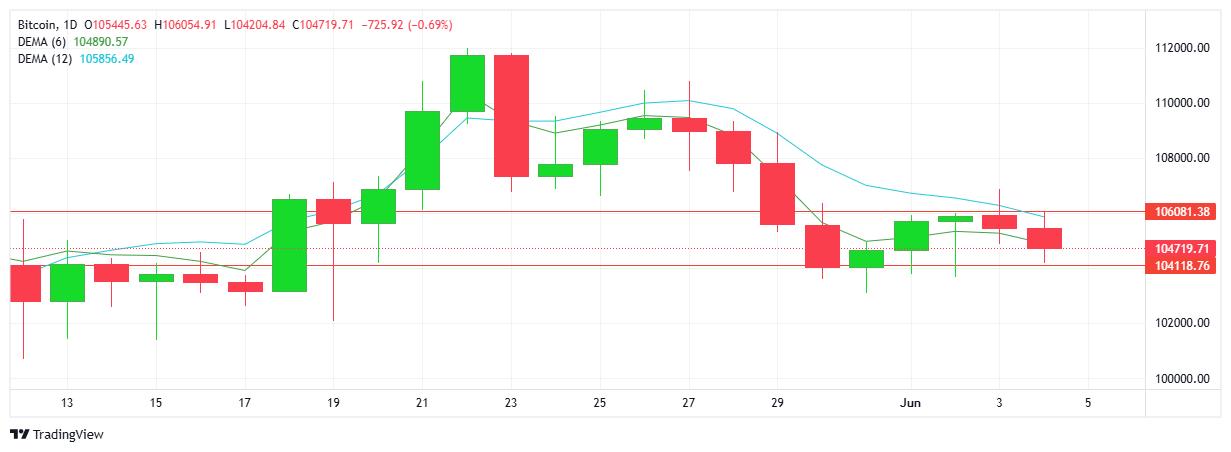
BITCOIN
Again a relative non-event with price action contained within a narrow $2K trading range. Resistance sits at $106K with support measured at $104.1K. The bias is tilted downward and todays candle reflects a lower high and lower low within the downtrend. Note the strong support area at $104K which has held strong for the past 6 trading days. Buyers will aim to break out of the sideways range and test $107K on the upside.