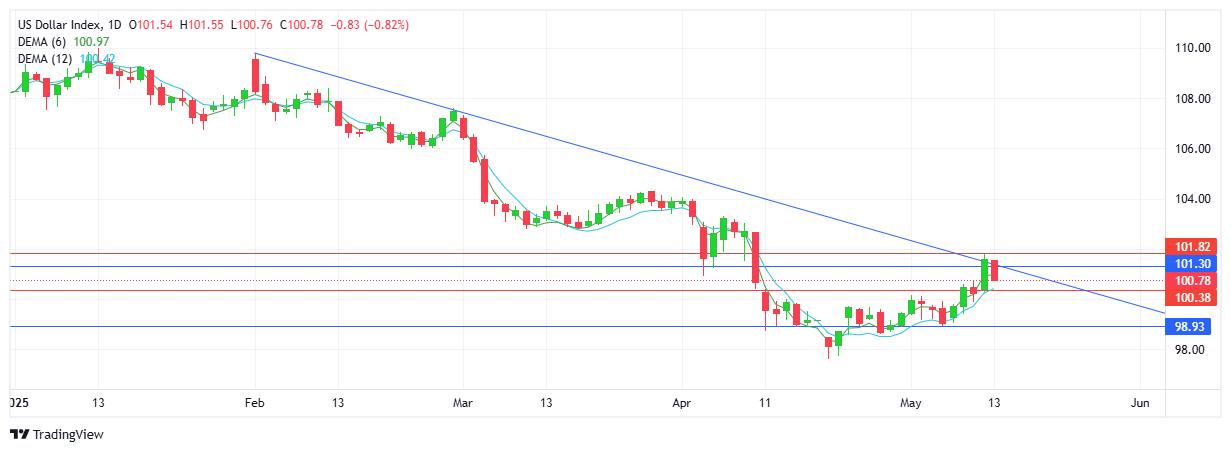
USD INDEX
Sellers were in control from the open and went on to give up more than 50% of yesterdays gains. In so doing price action returned to trade below the year long downtrend as reflected by the descending trendline. While the daily trend remains up, both the 4 hr and hourly have reversed down. Resistance sits at 101.58 with support established at 100.73. Sellers may see yesterdays resistance as a new lower high on the daily charts. Note the sell-off today is in keeping with the inverse relationship between the USD and equity markets.
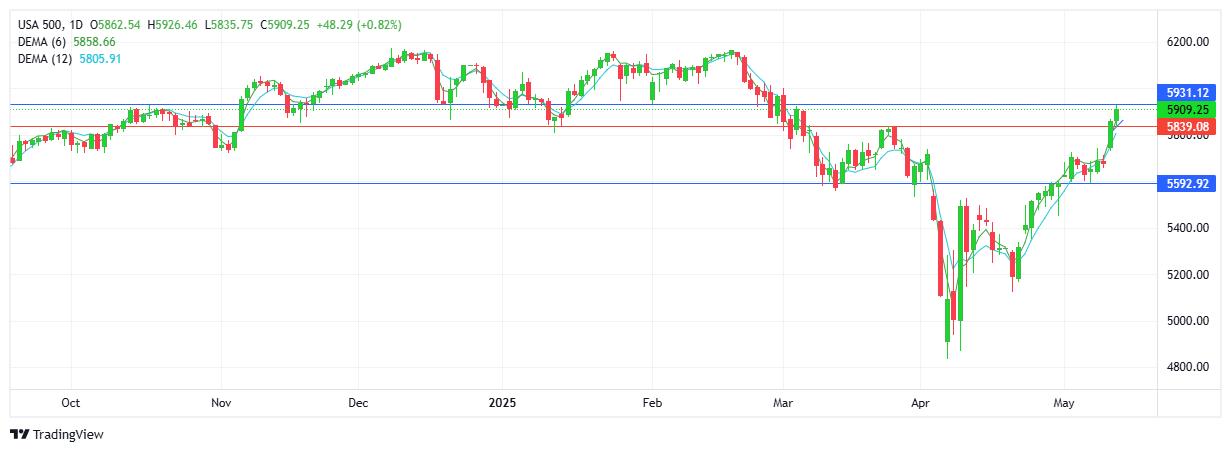
S&P 500
Buyers followed up on yesterdays gains and added to the uptrend with steady demand reflected in the successive pattern of higher highs and higher lows. Resistance now sits at 5931 with support at 5839. Although no new trade deals or tariff related announcements were released, it seems that no news is good news as the market craves certainty. Are 30% tariffs acceptable? Yes, if they remain fixed and allows business to plan accordingly. In the absence of any negative developments, buyers will be eyeing the relevant 6000 level.
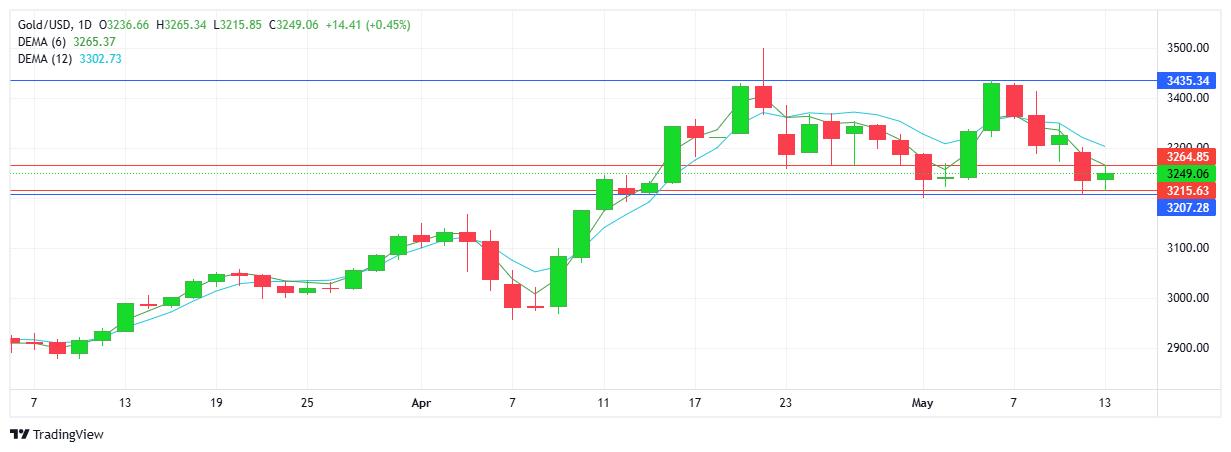
GOLD
Buyers stepped in to halt any further declines with support holding at $3215 with daily resistance set at $3264. Todays green candlestick was not enough to derail the downtrend which remains intact with a noticeably lower high on the daily candle. Noteworthy that gold’s push up was relatively timid in response to the strong USD sell-off. While buyers will aim to retake the $3300 mark, sellers will aim below $3200.
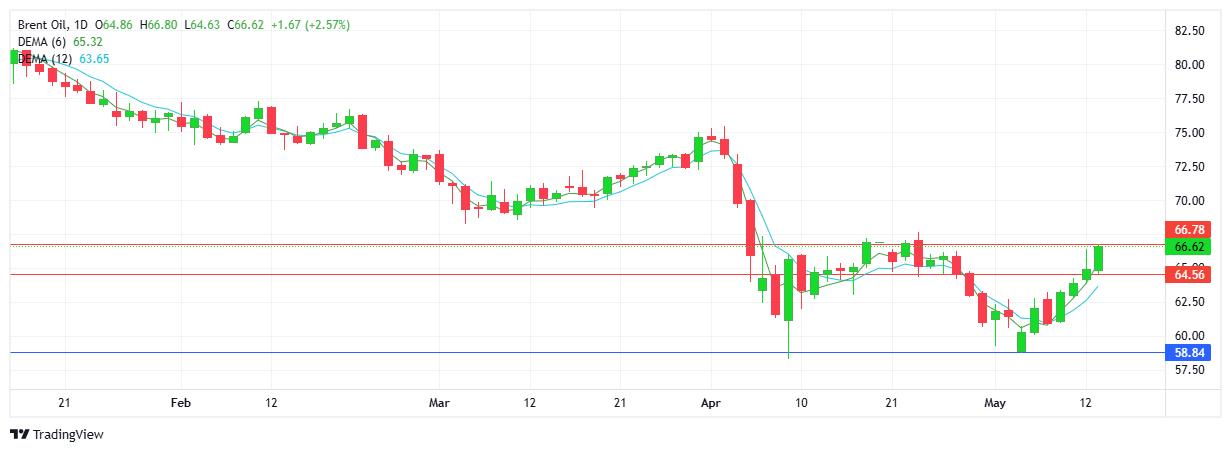
BRENT OIL
Another strong day saw the 6th consecutive higher high with buyers firmly in control and the leading EMA confirming the strong trend. Resistance established at $66.78 - notice this area was tested (unsuccessfully) last month and will be the first test of this new uptrend. Support sits at $64.56. Noteworthy that oil’s current push higher is moving in tandem with the S&P’s uptrend.
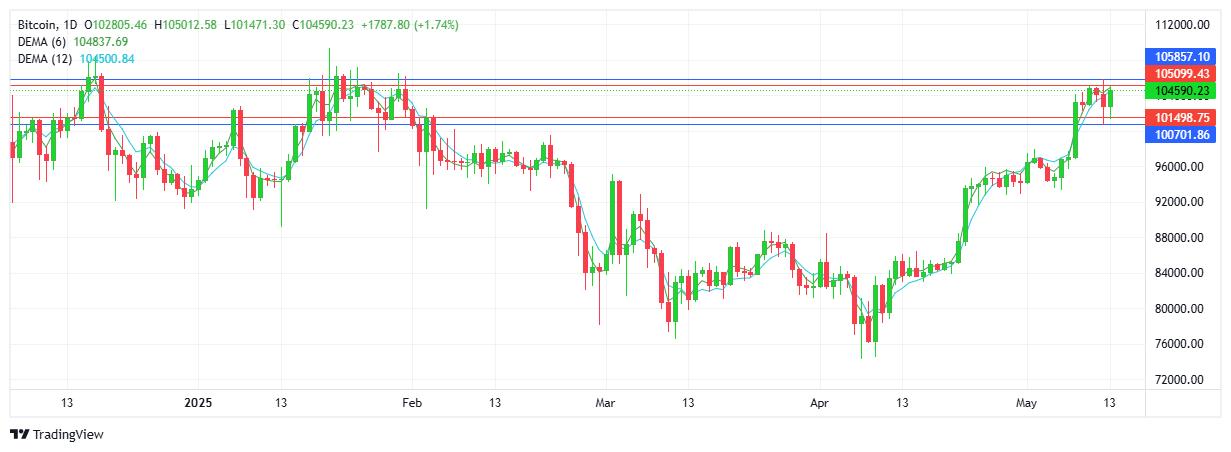
BITCOIN
Buyers won out today with price action contained within the big picture range between $100.7K on the downside and $105.8K on the upside. Todays support sits at $101.5 with resistance at $105K as the 5-day sideways trend remains intact. Buyers may see yesterdays low as a higher low on the daily charts. Noteworthy that since April similar sideways activity has produced a breakout to the upside. The trend is up and the bias is tilted upwards. RSI reading is 72.